Quick Start Guide
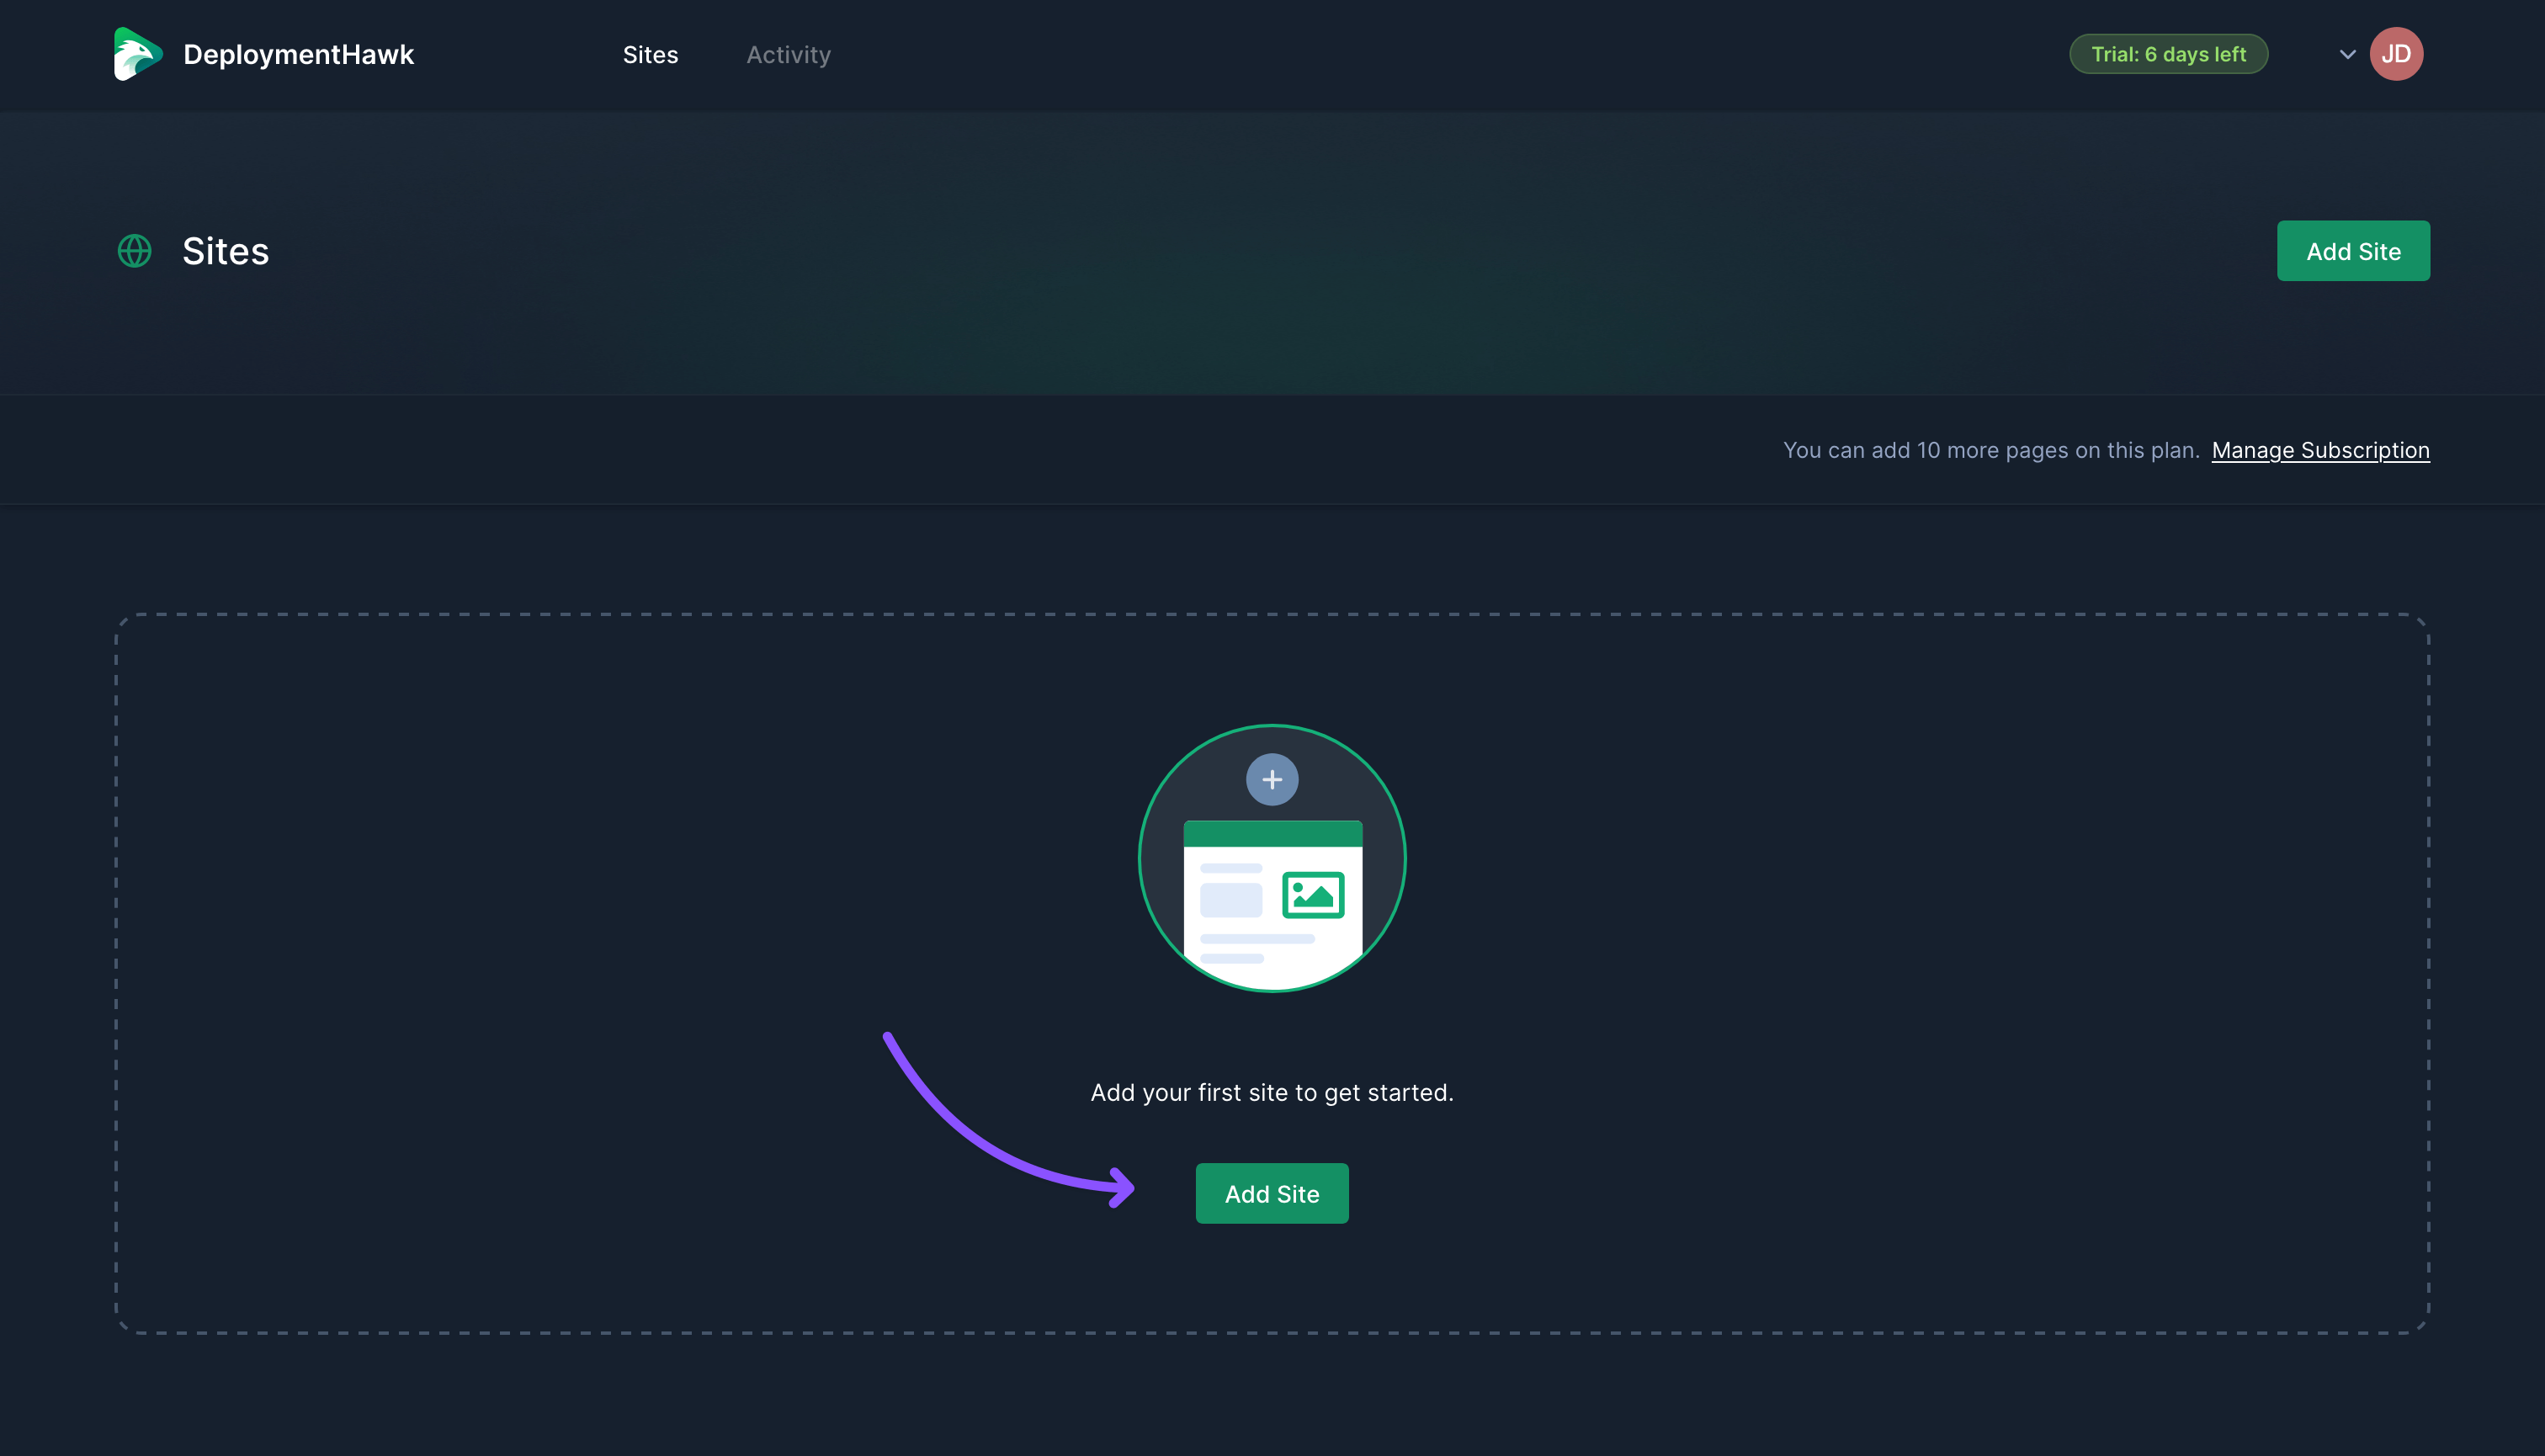
Once you've signed up for DeploymentHawk, it's time to add your first site. To do so, click Add Site on the dashboard.
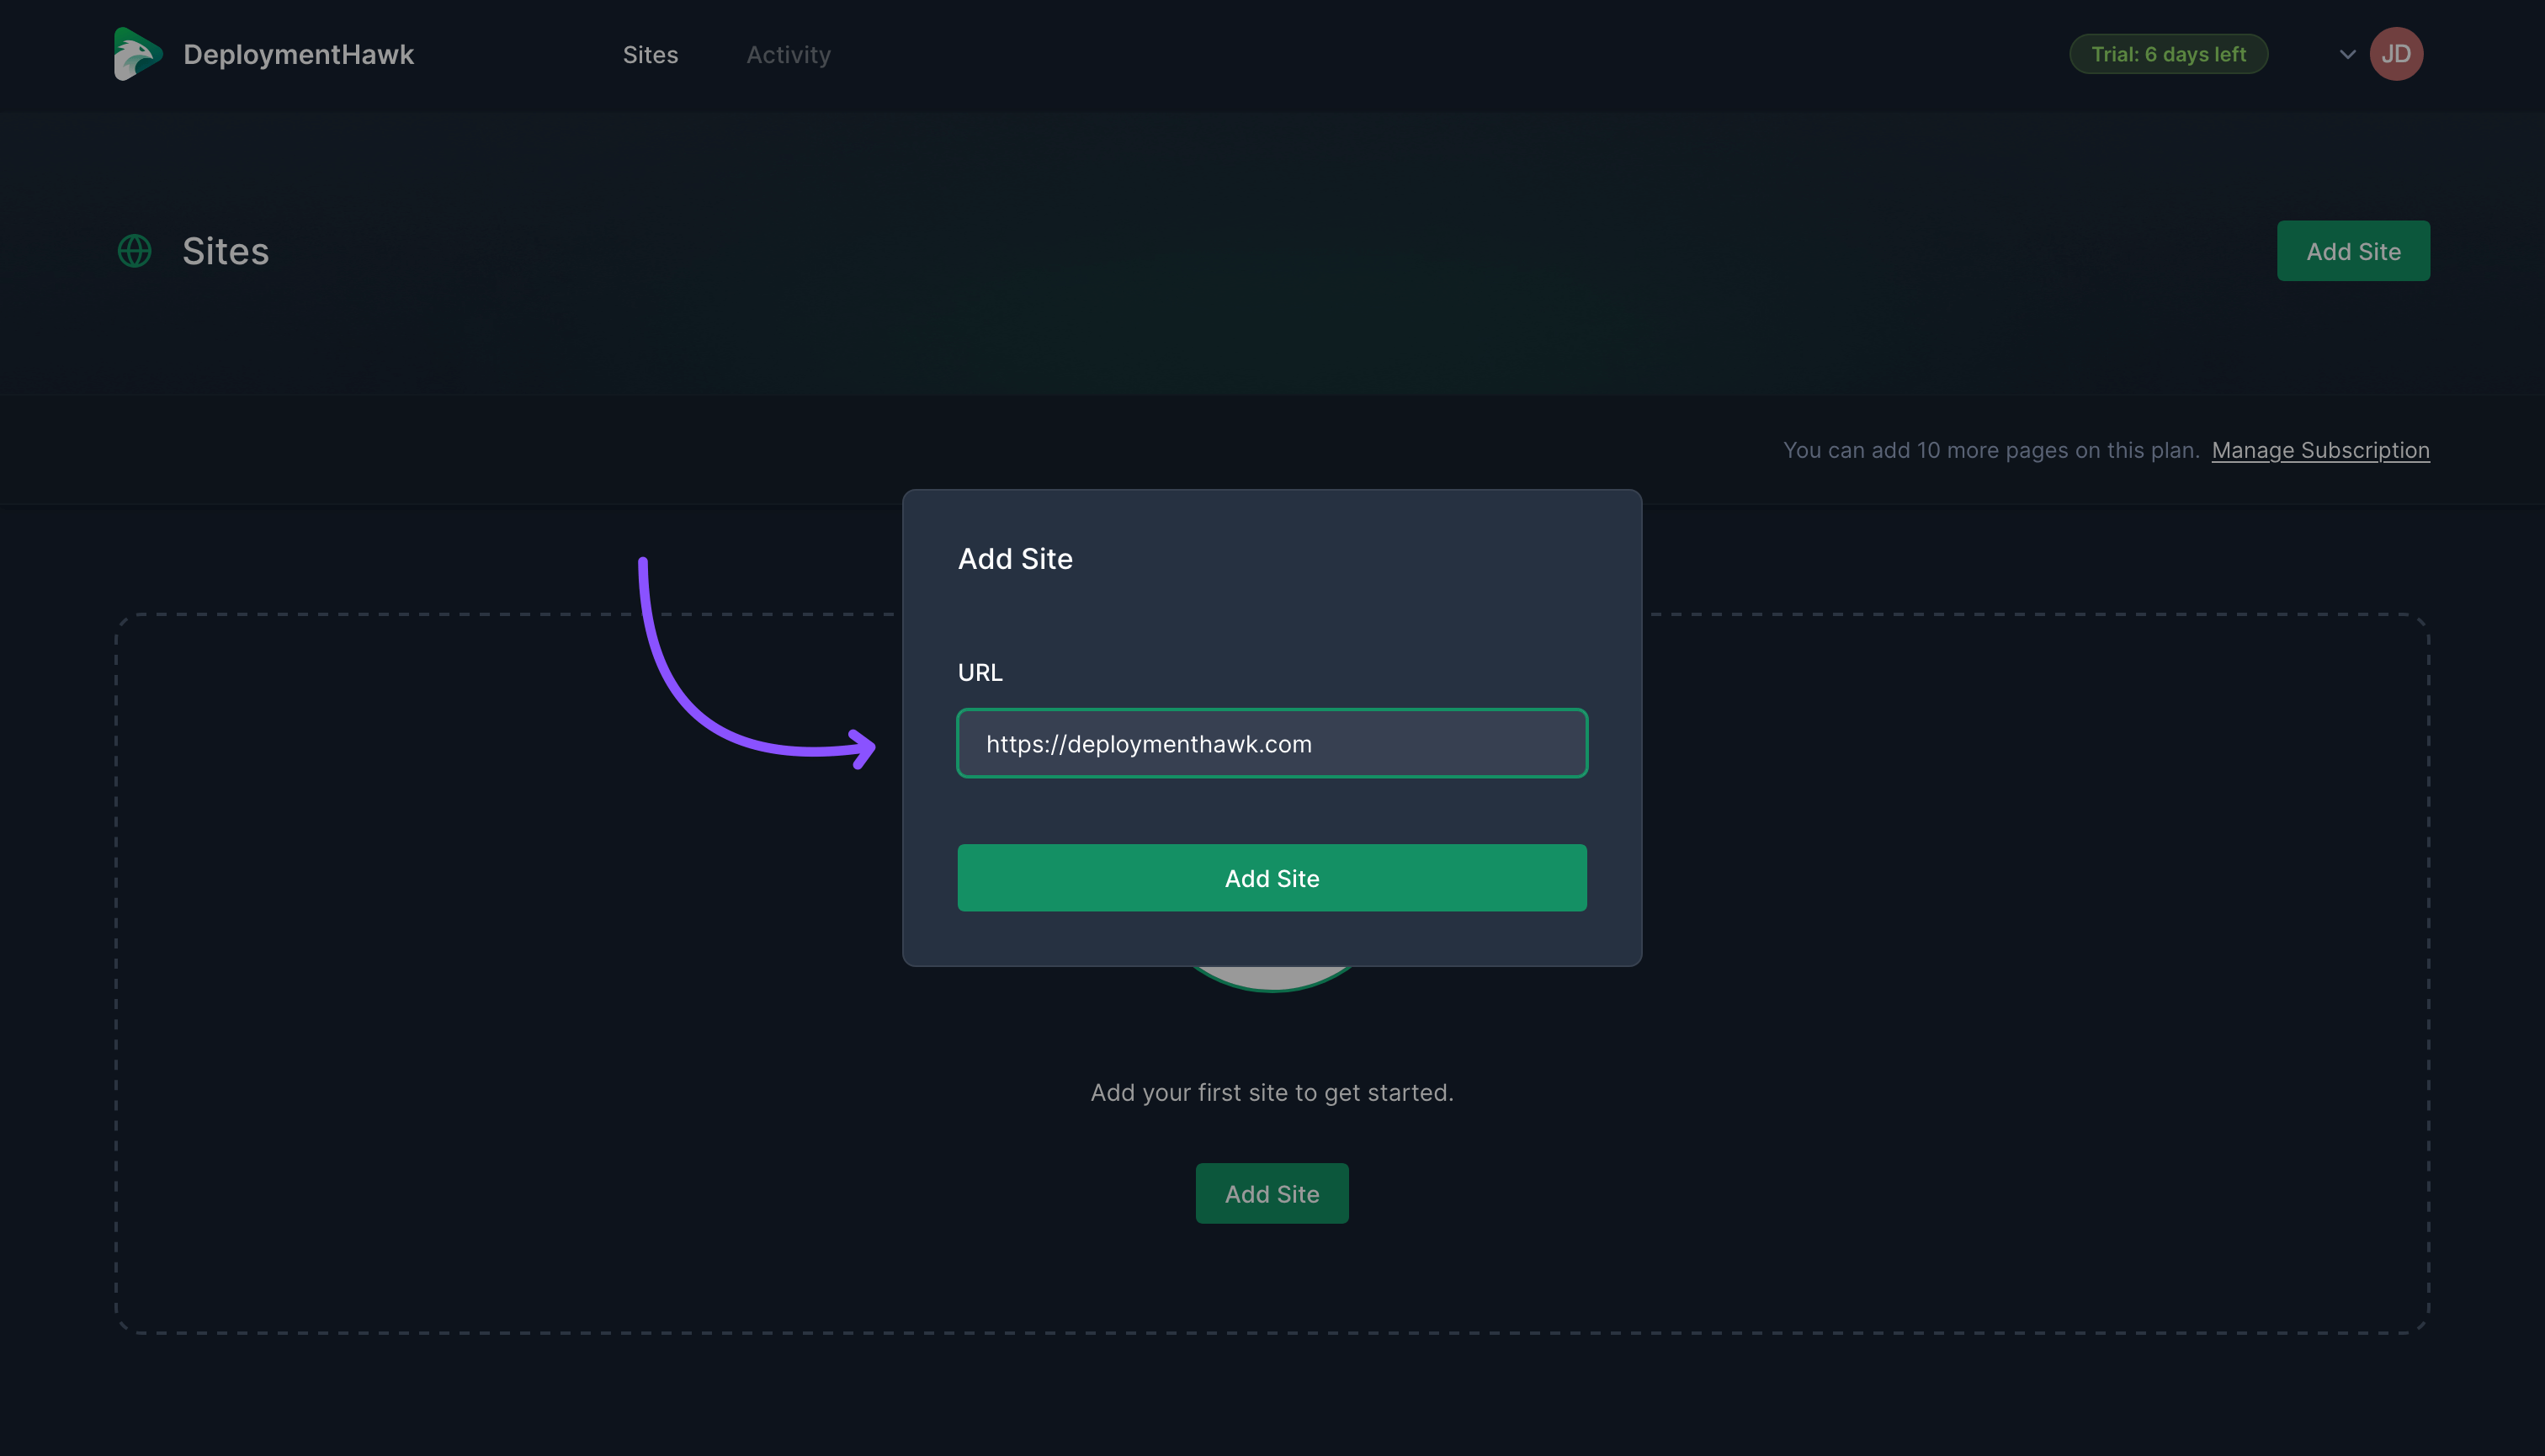
 You'll be prompted to enter the site's URL. This should be the site's root URL and include the scheme (HTTP or HTTPS).
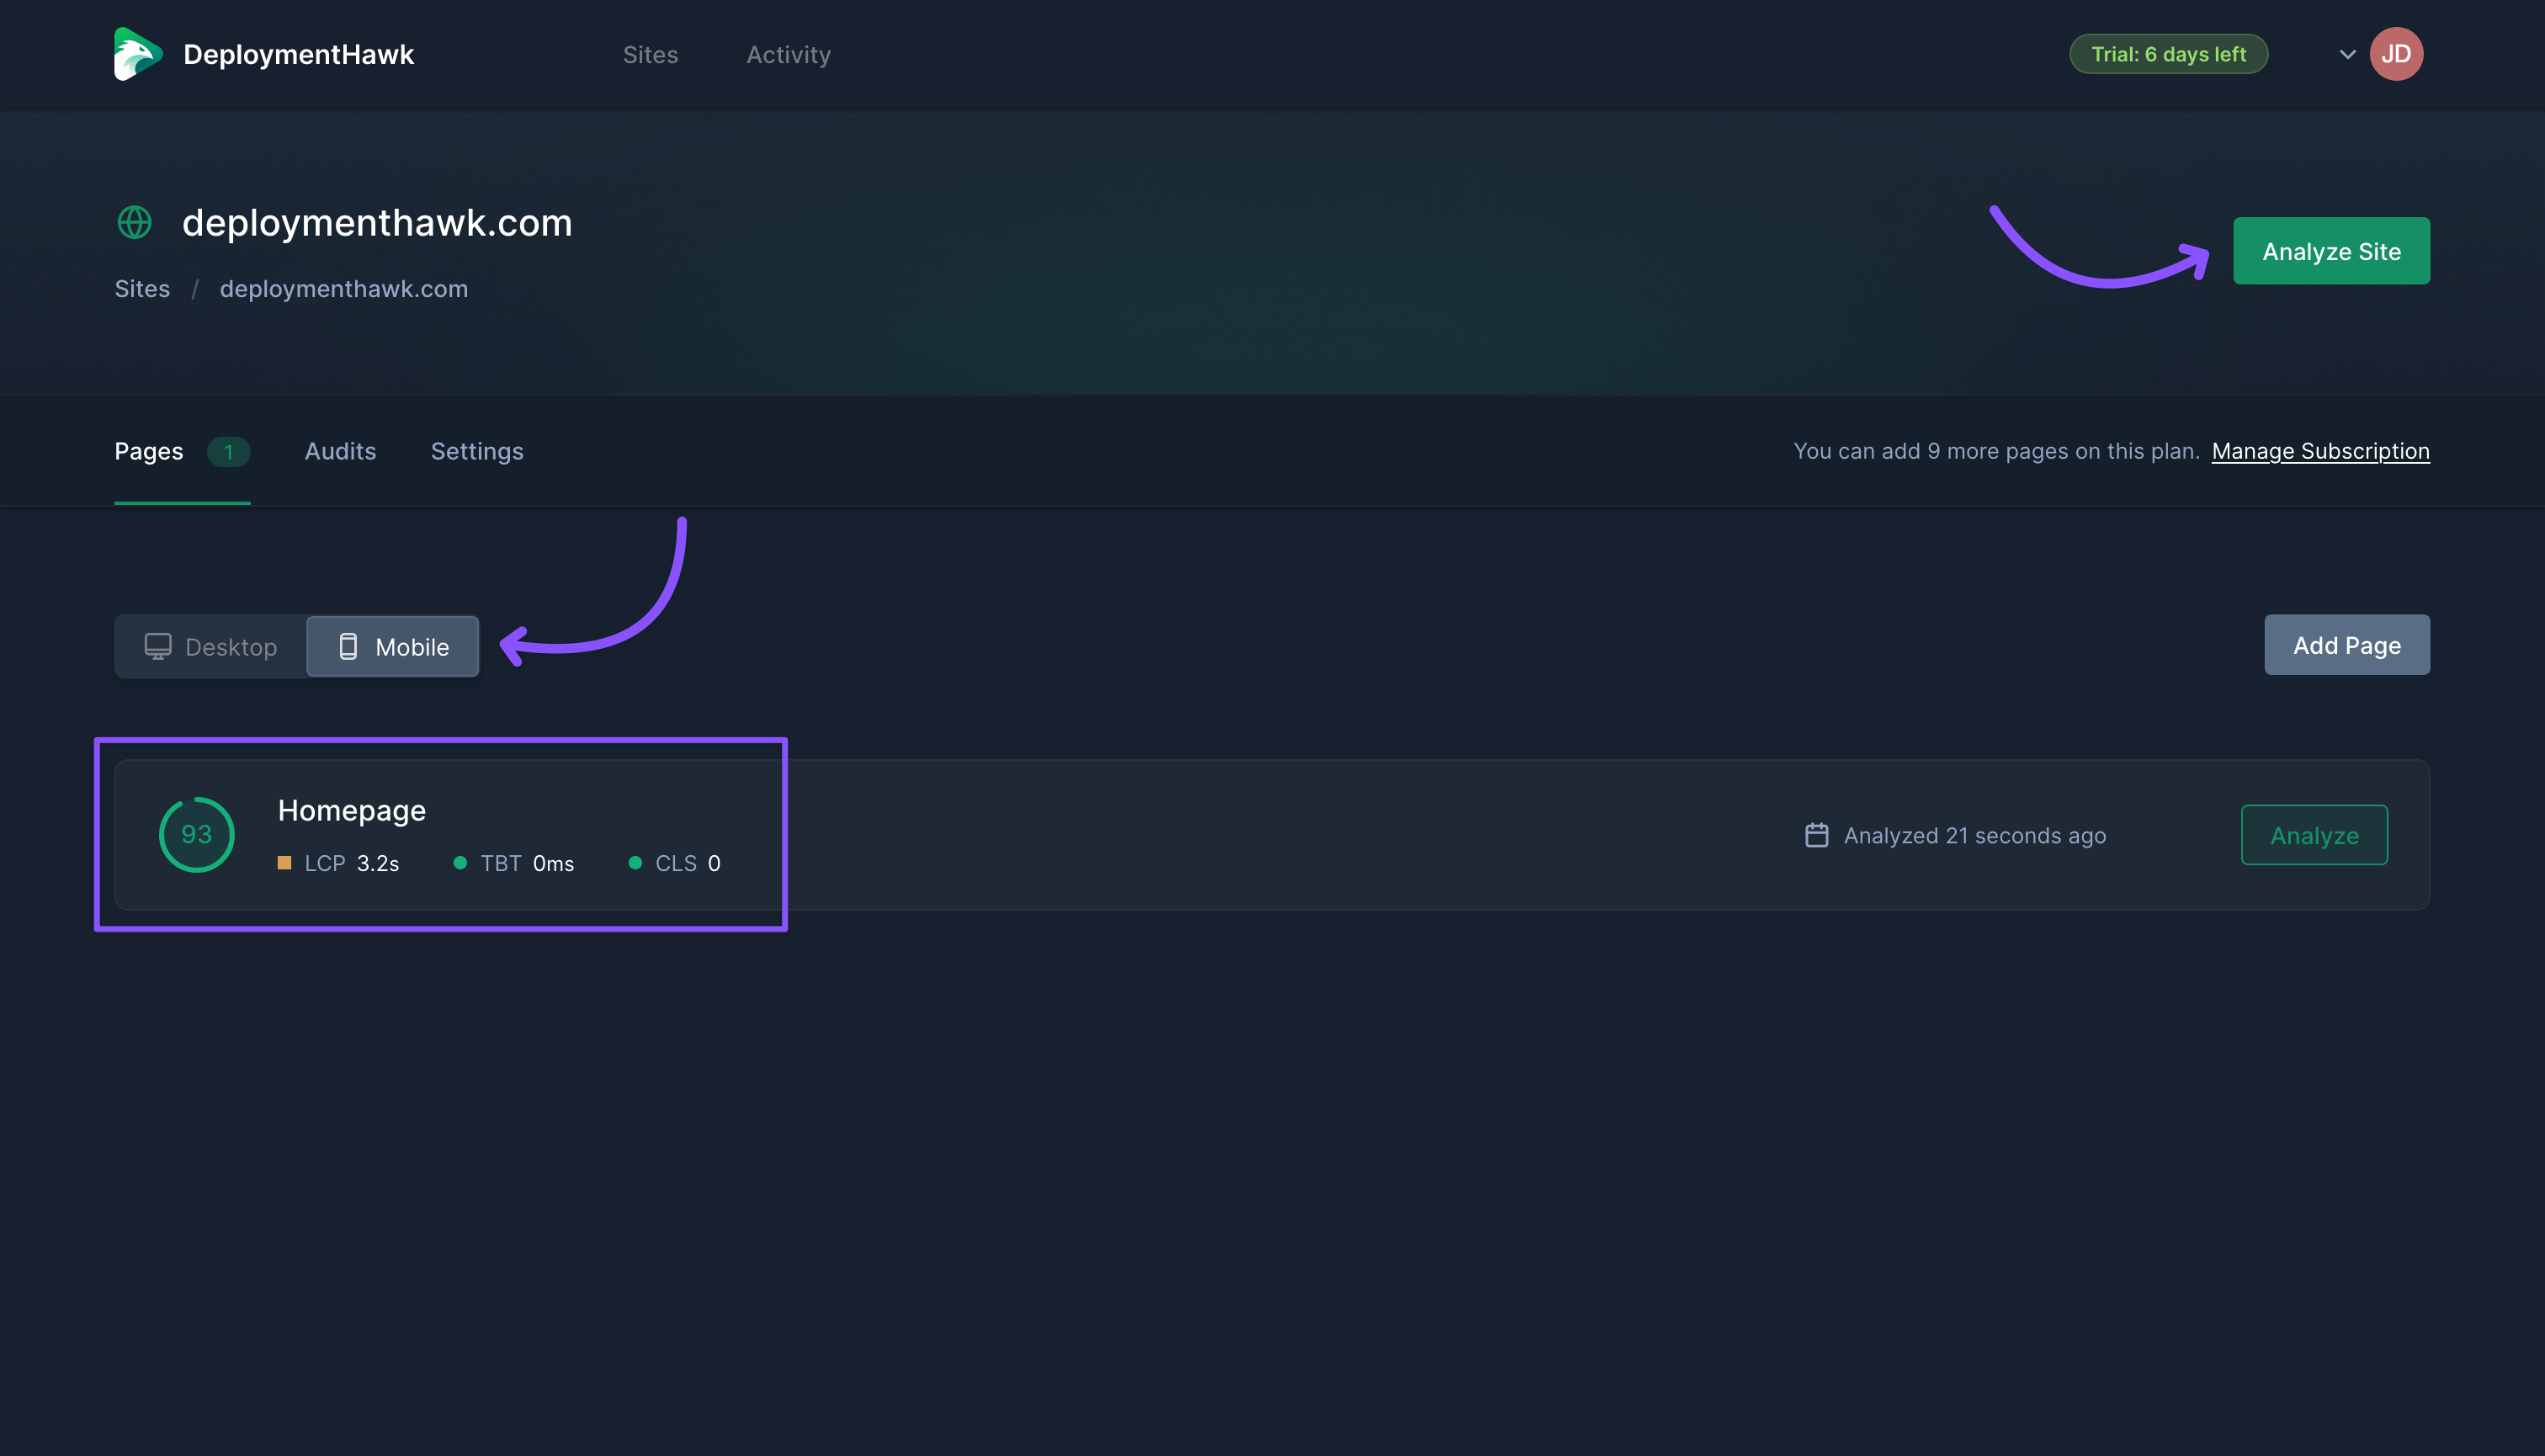
 Once you've added your site, you'll be redirected to the site's dashboard, and your first homepage audit will run in the background. Once complete, you'll see your performance score and a few key performance metrics contributing to the score.
On this screen, you can toggle between Desktop and Mobile to see an overview of their corresponding performance scores and trigger on-demand audits using the Analyze Site button.
#Pages
DeploymentHawk works differently from other performance tools in that you can monitor multiple pages that will be audited when a deployment occurs or on-demand.
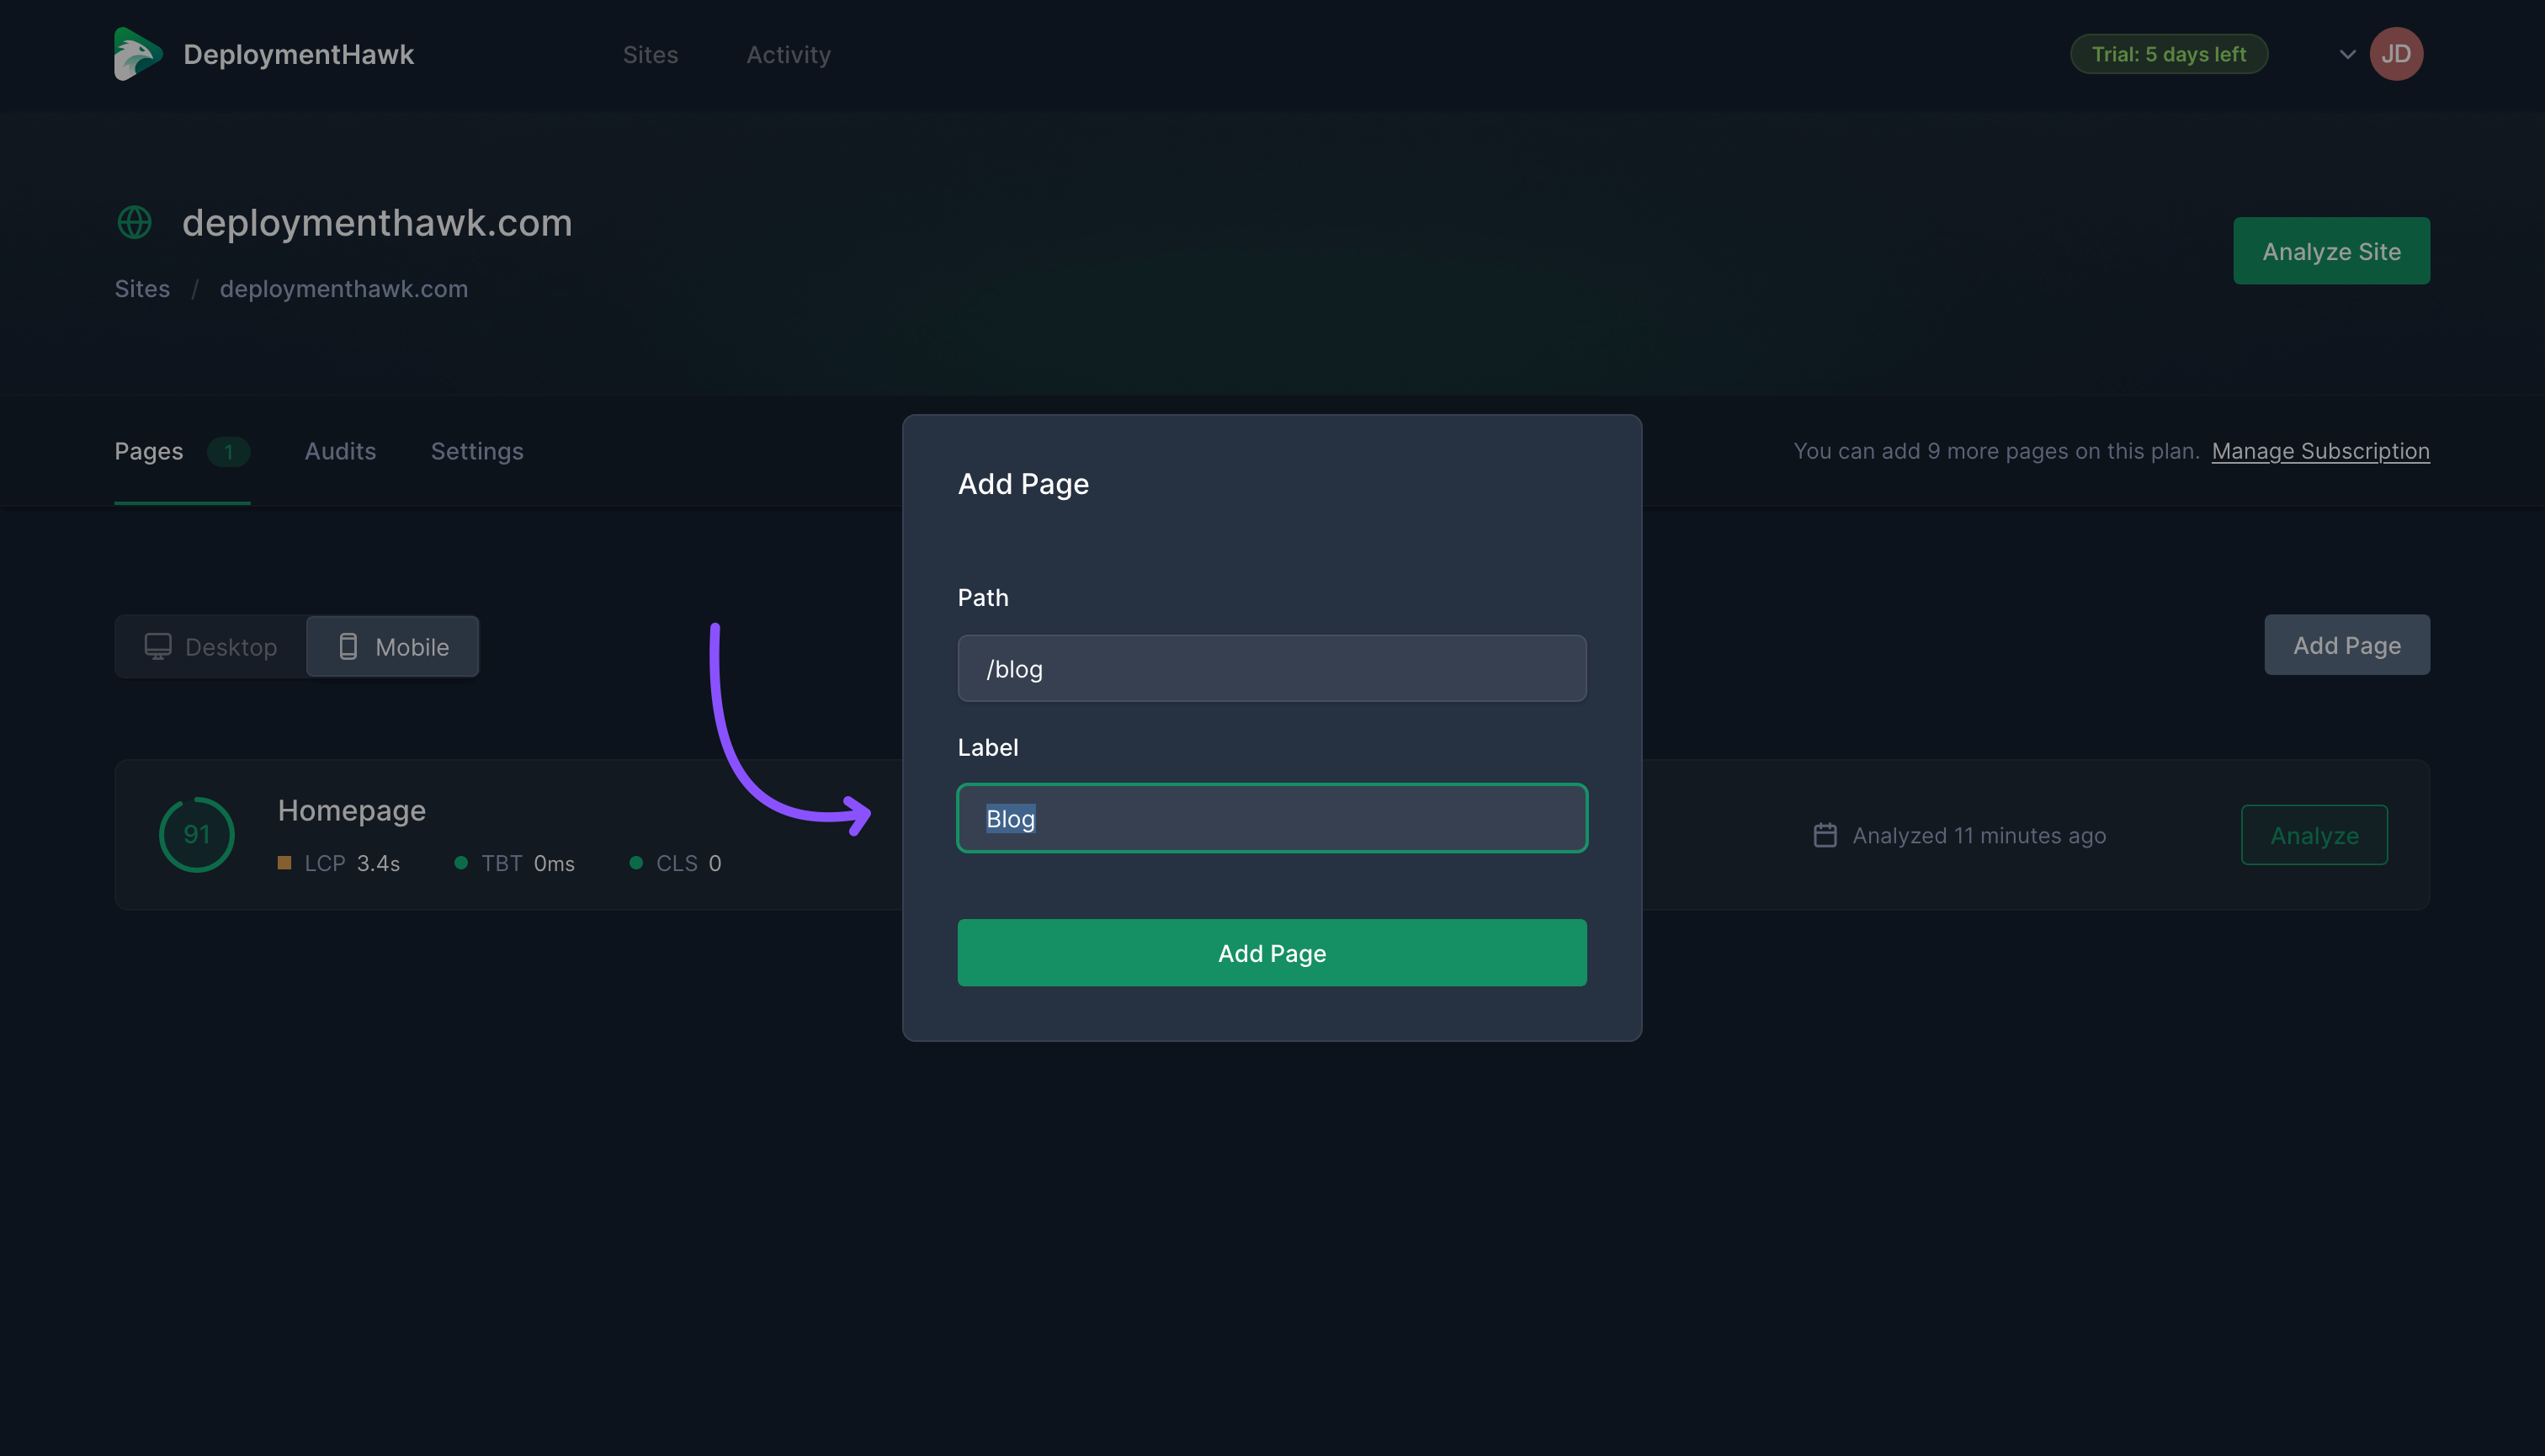
To add a new page, click Add Page and enter the page's URI (path relative to the root URL). You can add as many pages to a site as you like, but each page will count toward your plan limit.
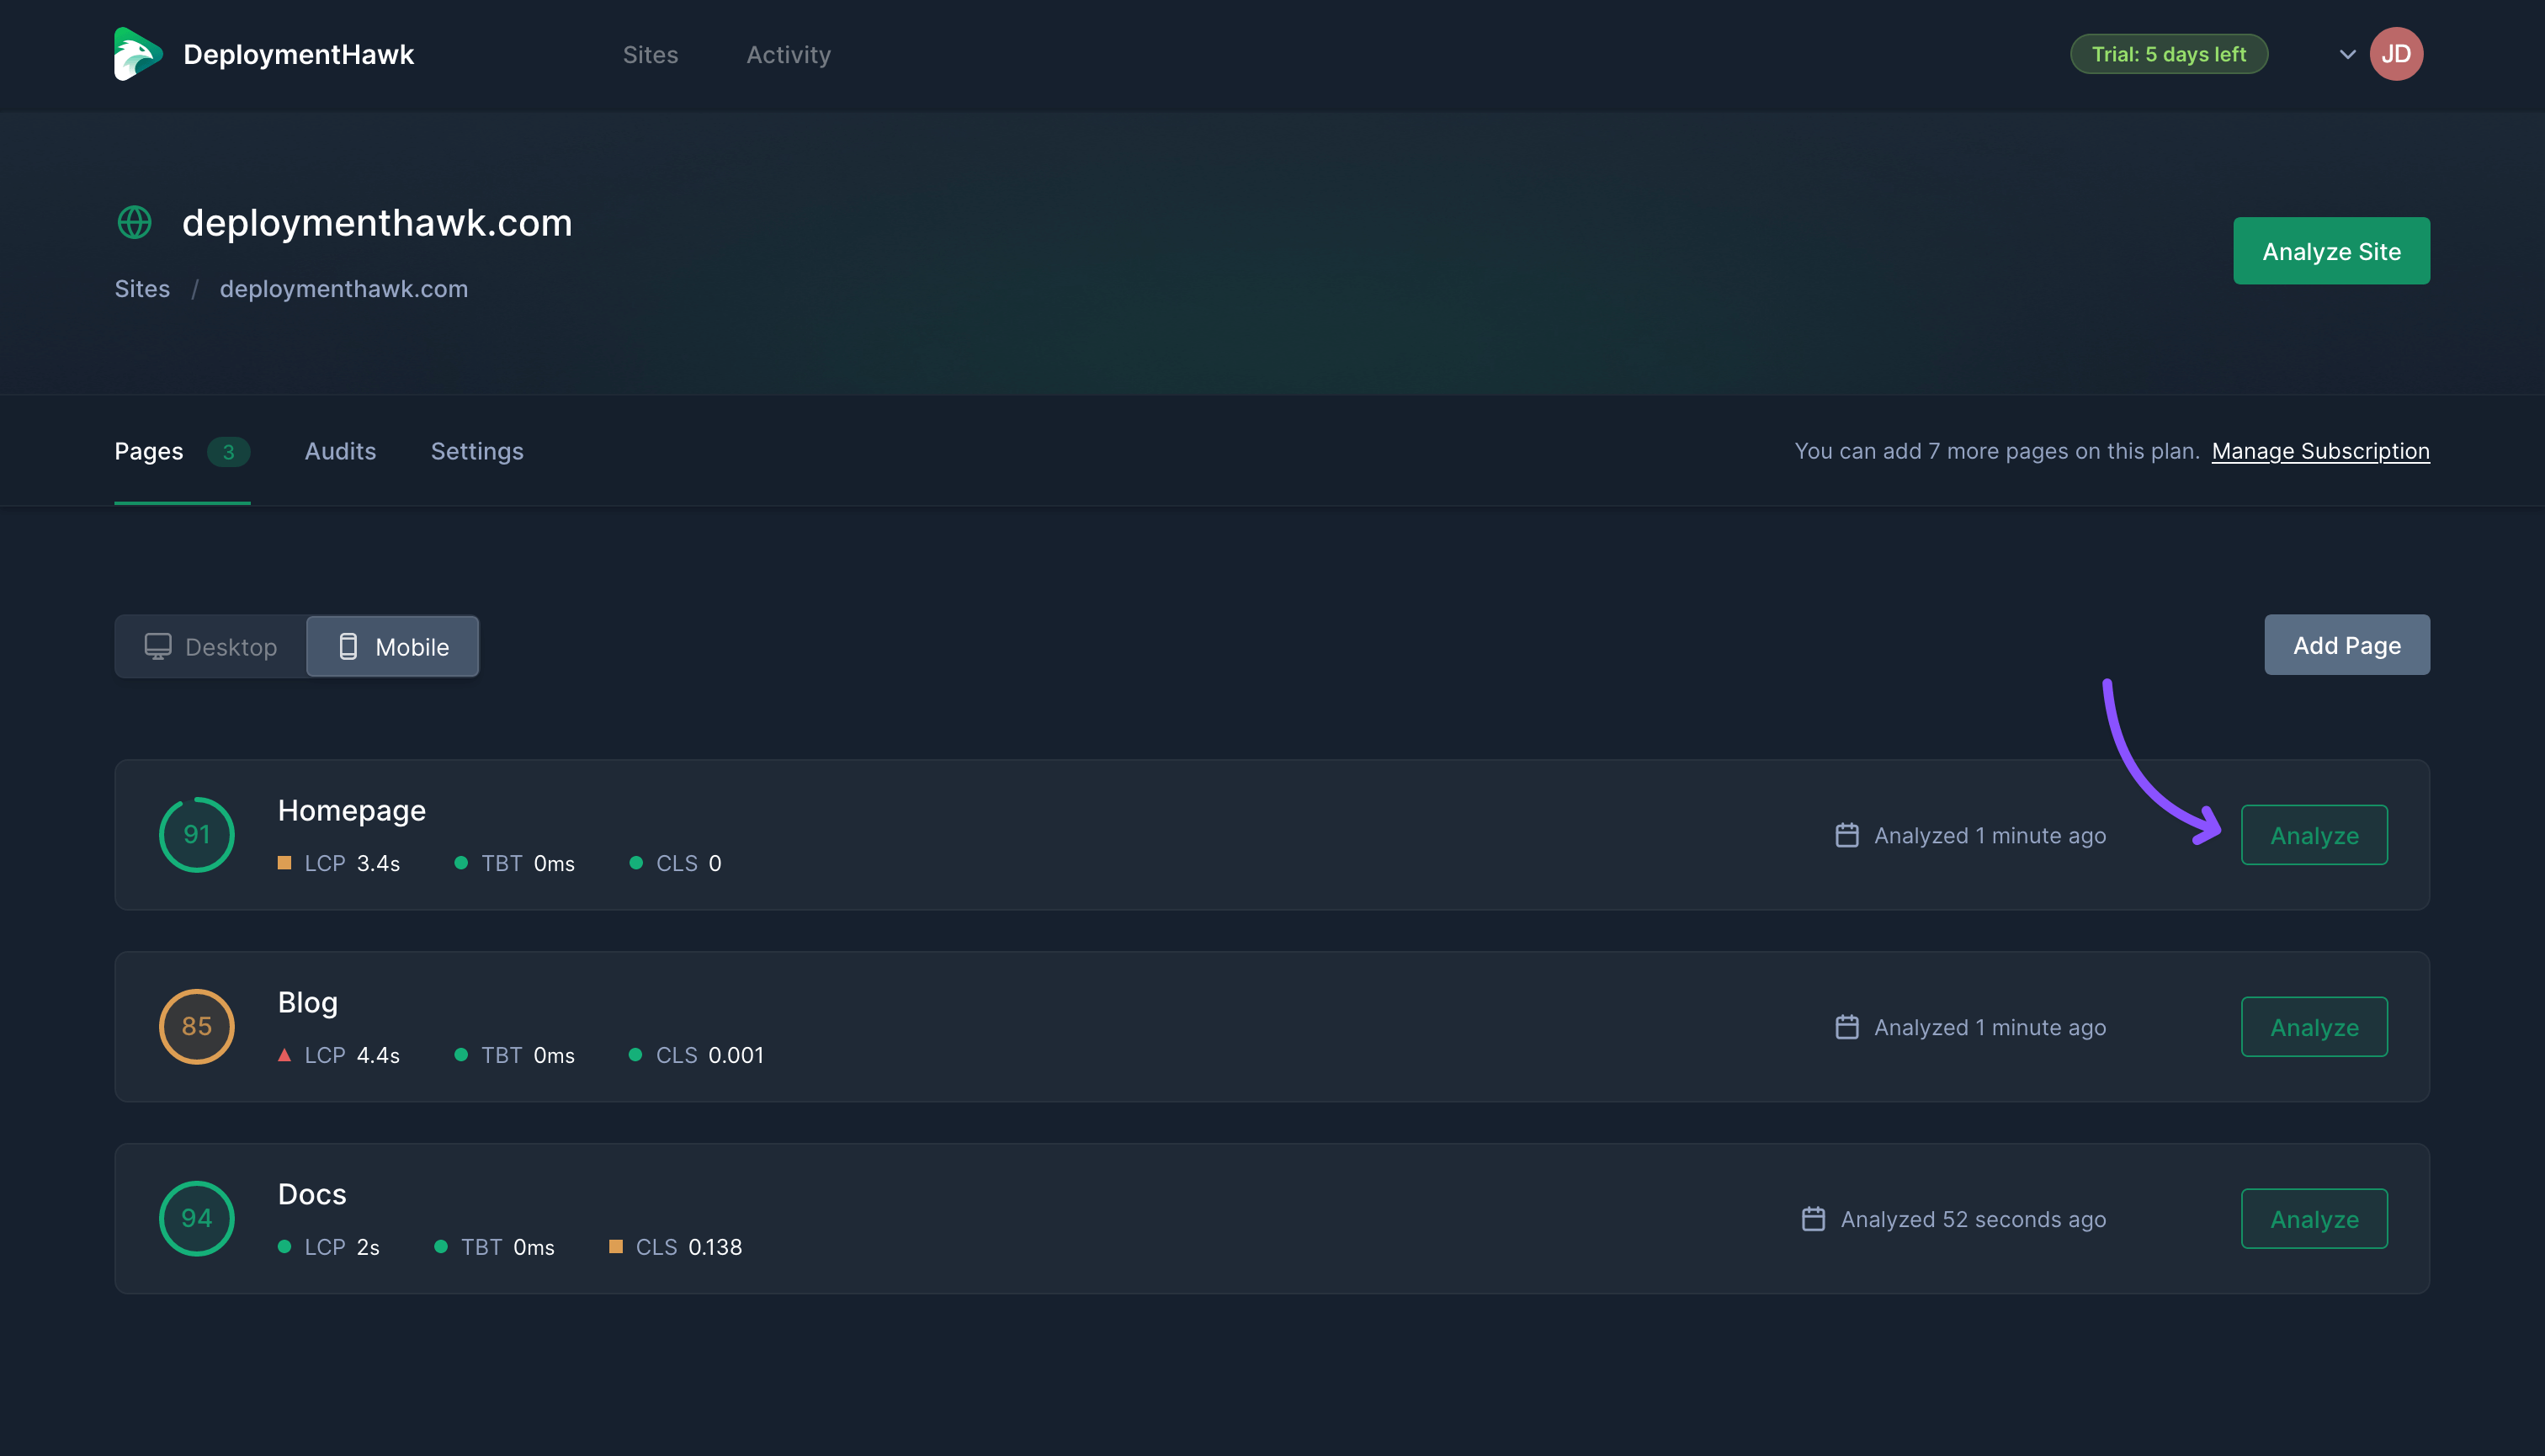
 Once you've added your pages, click Analyze Site to audit all the site's pages. Alternatively, you can analyze a single page using the page's corresponding Analyze button.
#Automated Audits
Automated audits are DeploymentHawk's superpower. They allow you to audit your site's monitored pages via a deployment webhook. You'll receive a full report for each monitored page for both desktop and mobile devices.
Automated audits can be used as a feedback loop; as you deploy updates to your site, you'll receive instant feedback on how the changes have affected performance, SEO, accessibility, and overall user experience.
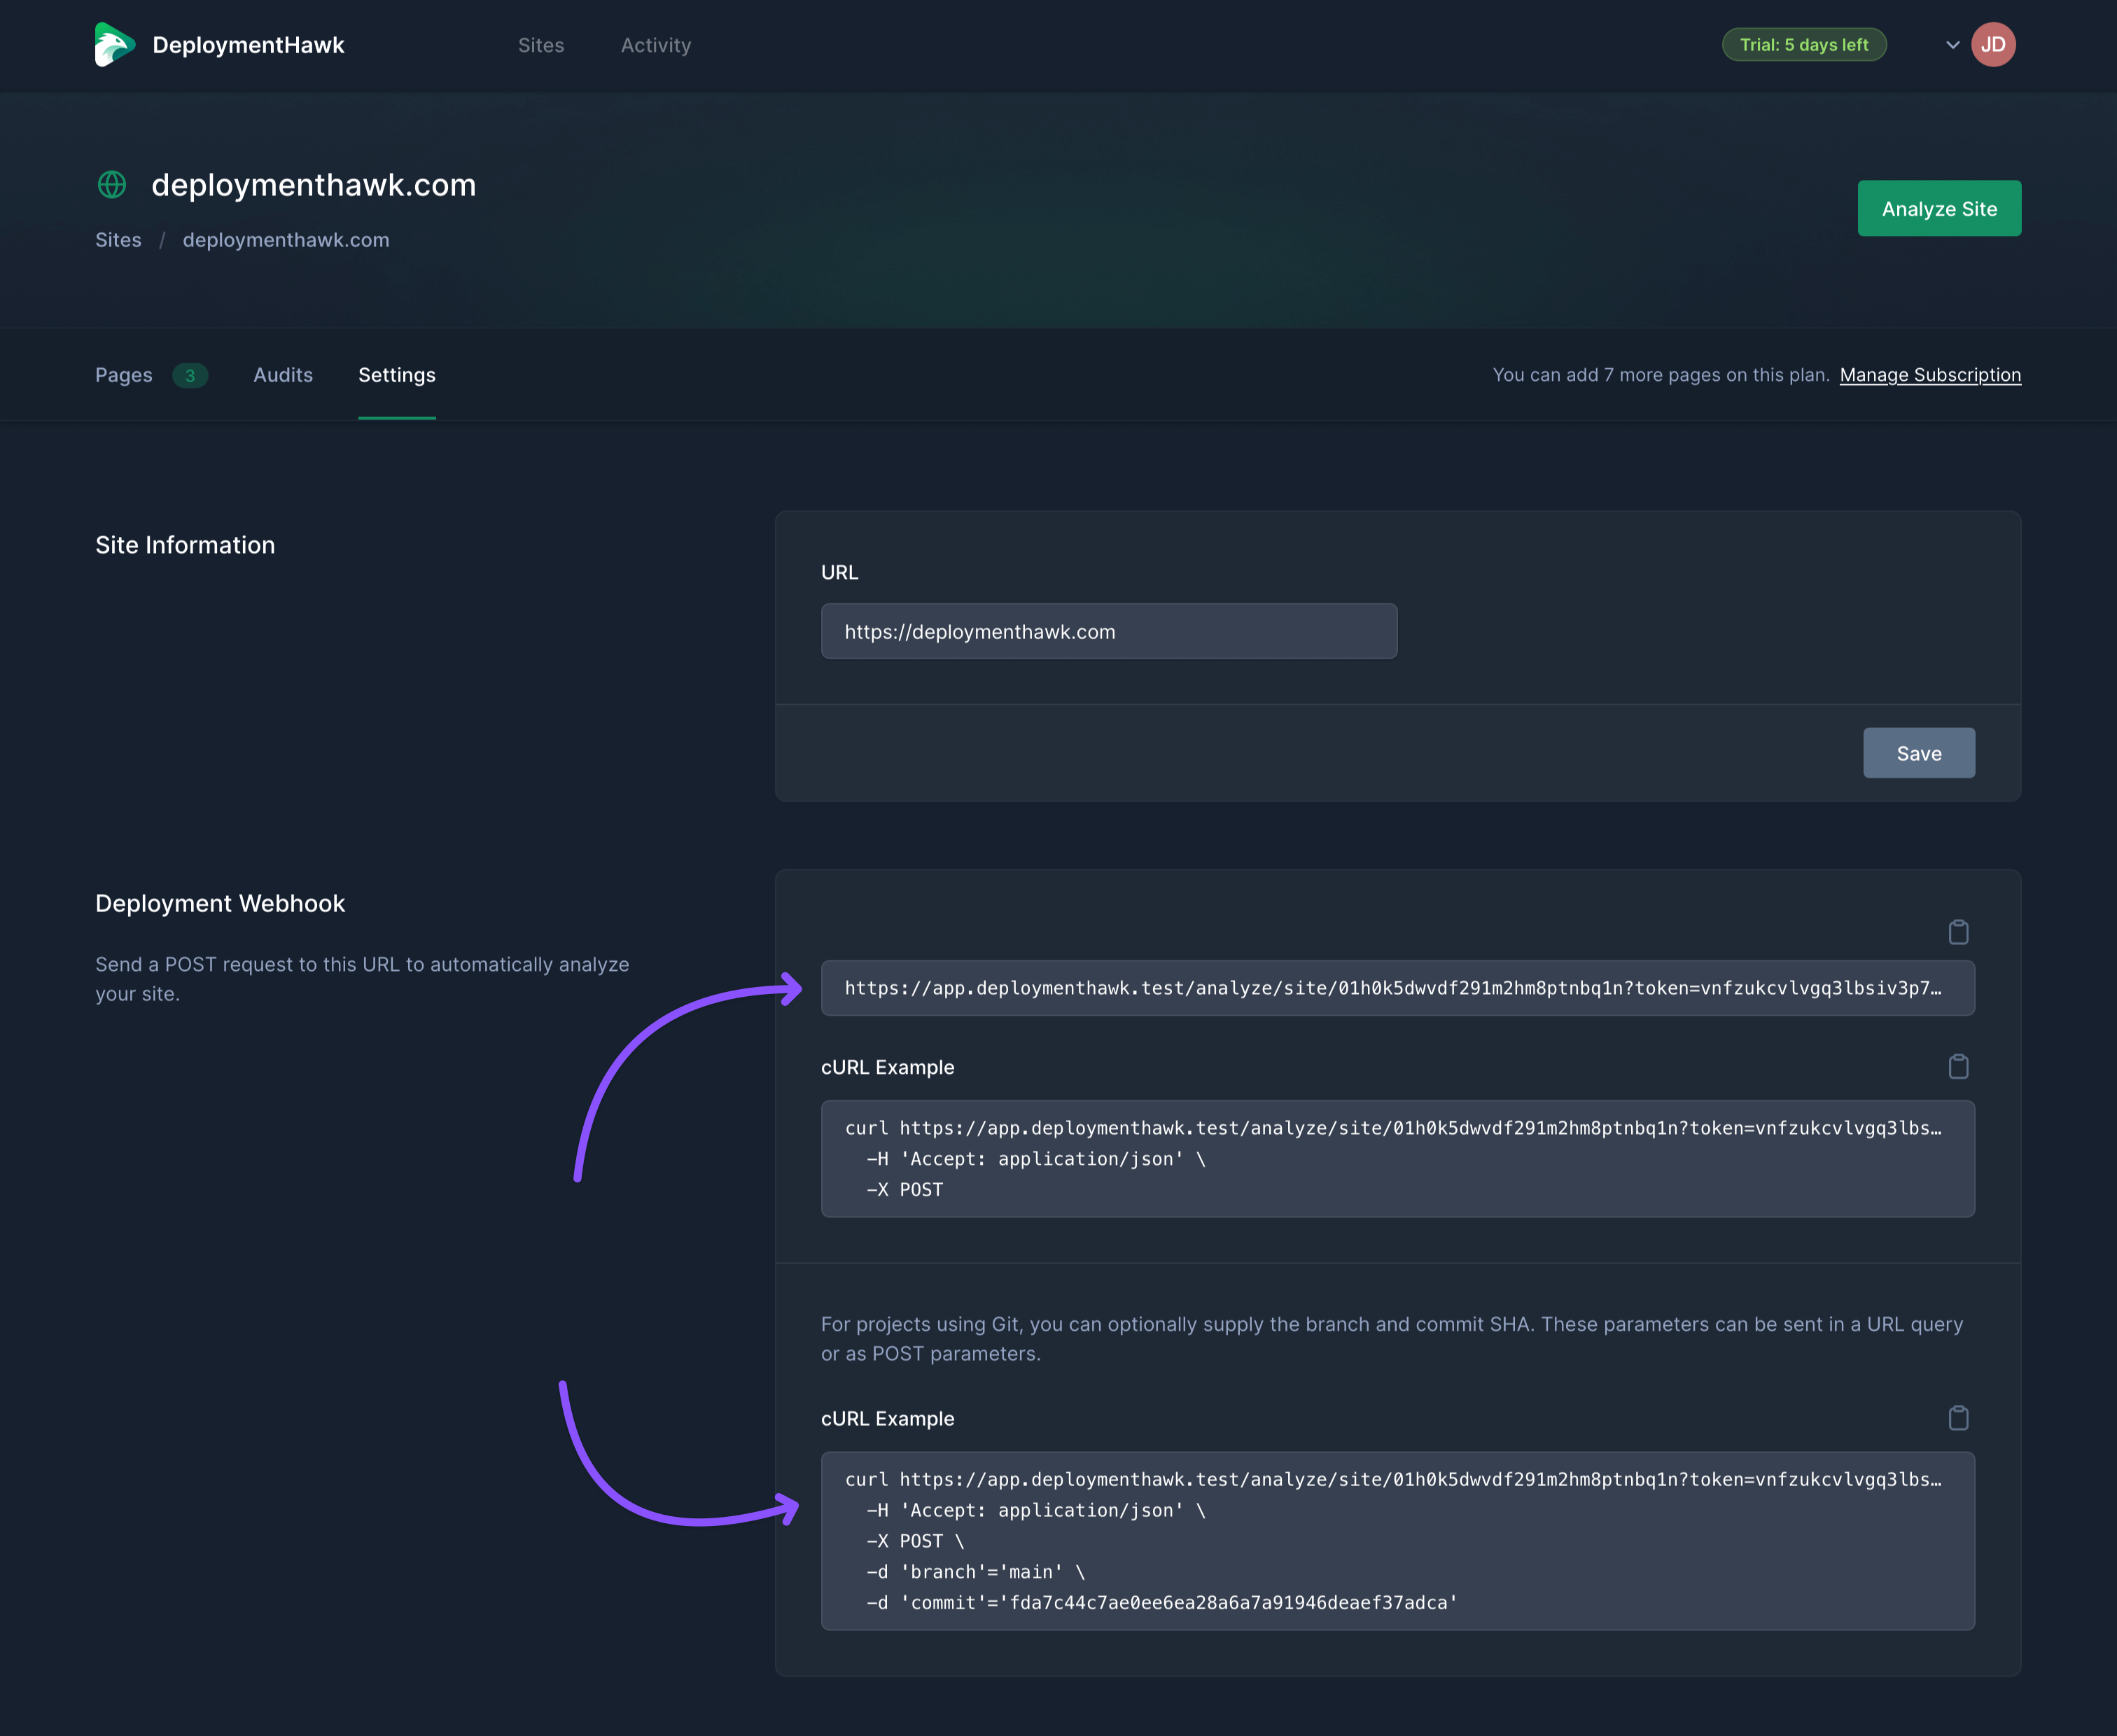
To set up automated audits, head to the site's Settings tab, where you can copy your unique deployment URL. Sending a POST request to this URL will trigger an audit. We also provide an example cURL command for bash scripts and CI/CD pipelines.
Additionally, if you're using Git, you can pass a branch and commit hash to know precisely what revision has been audited.
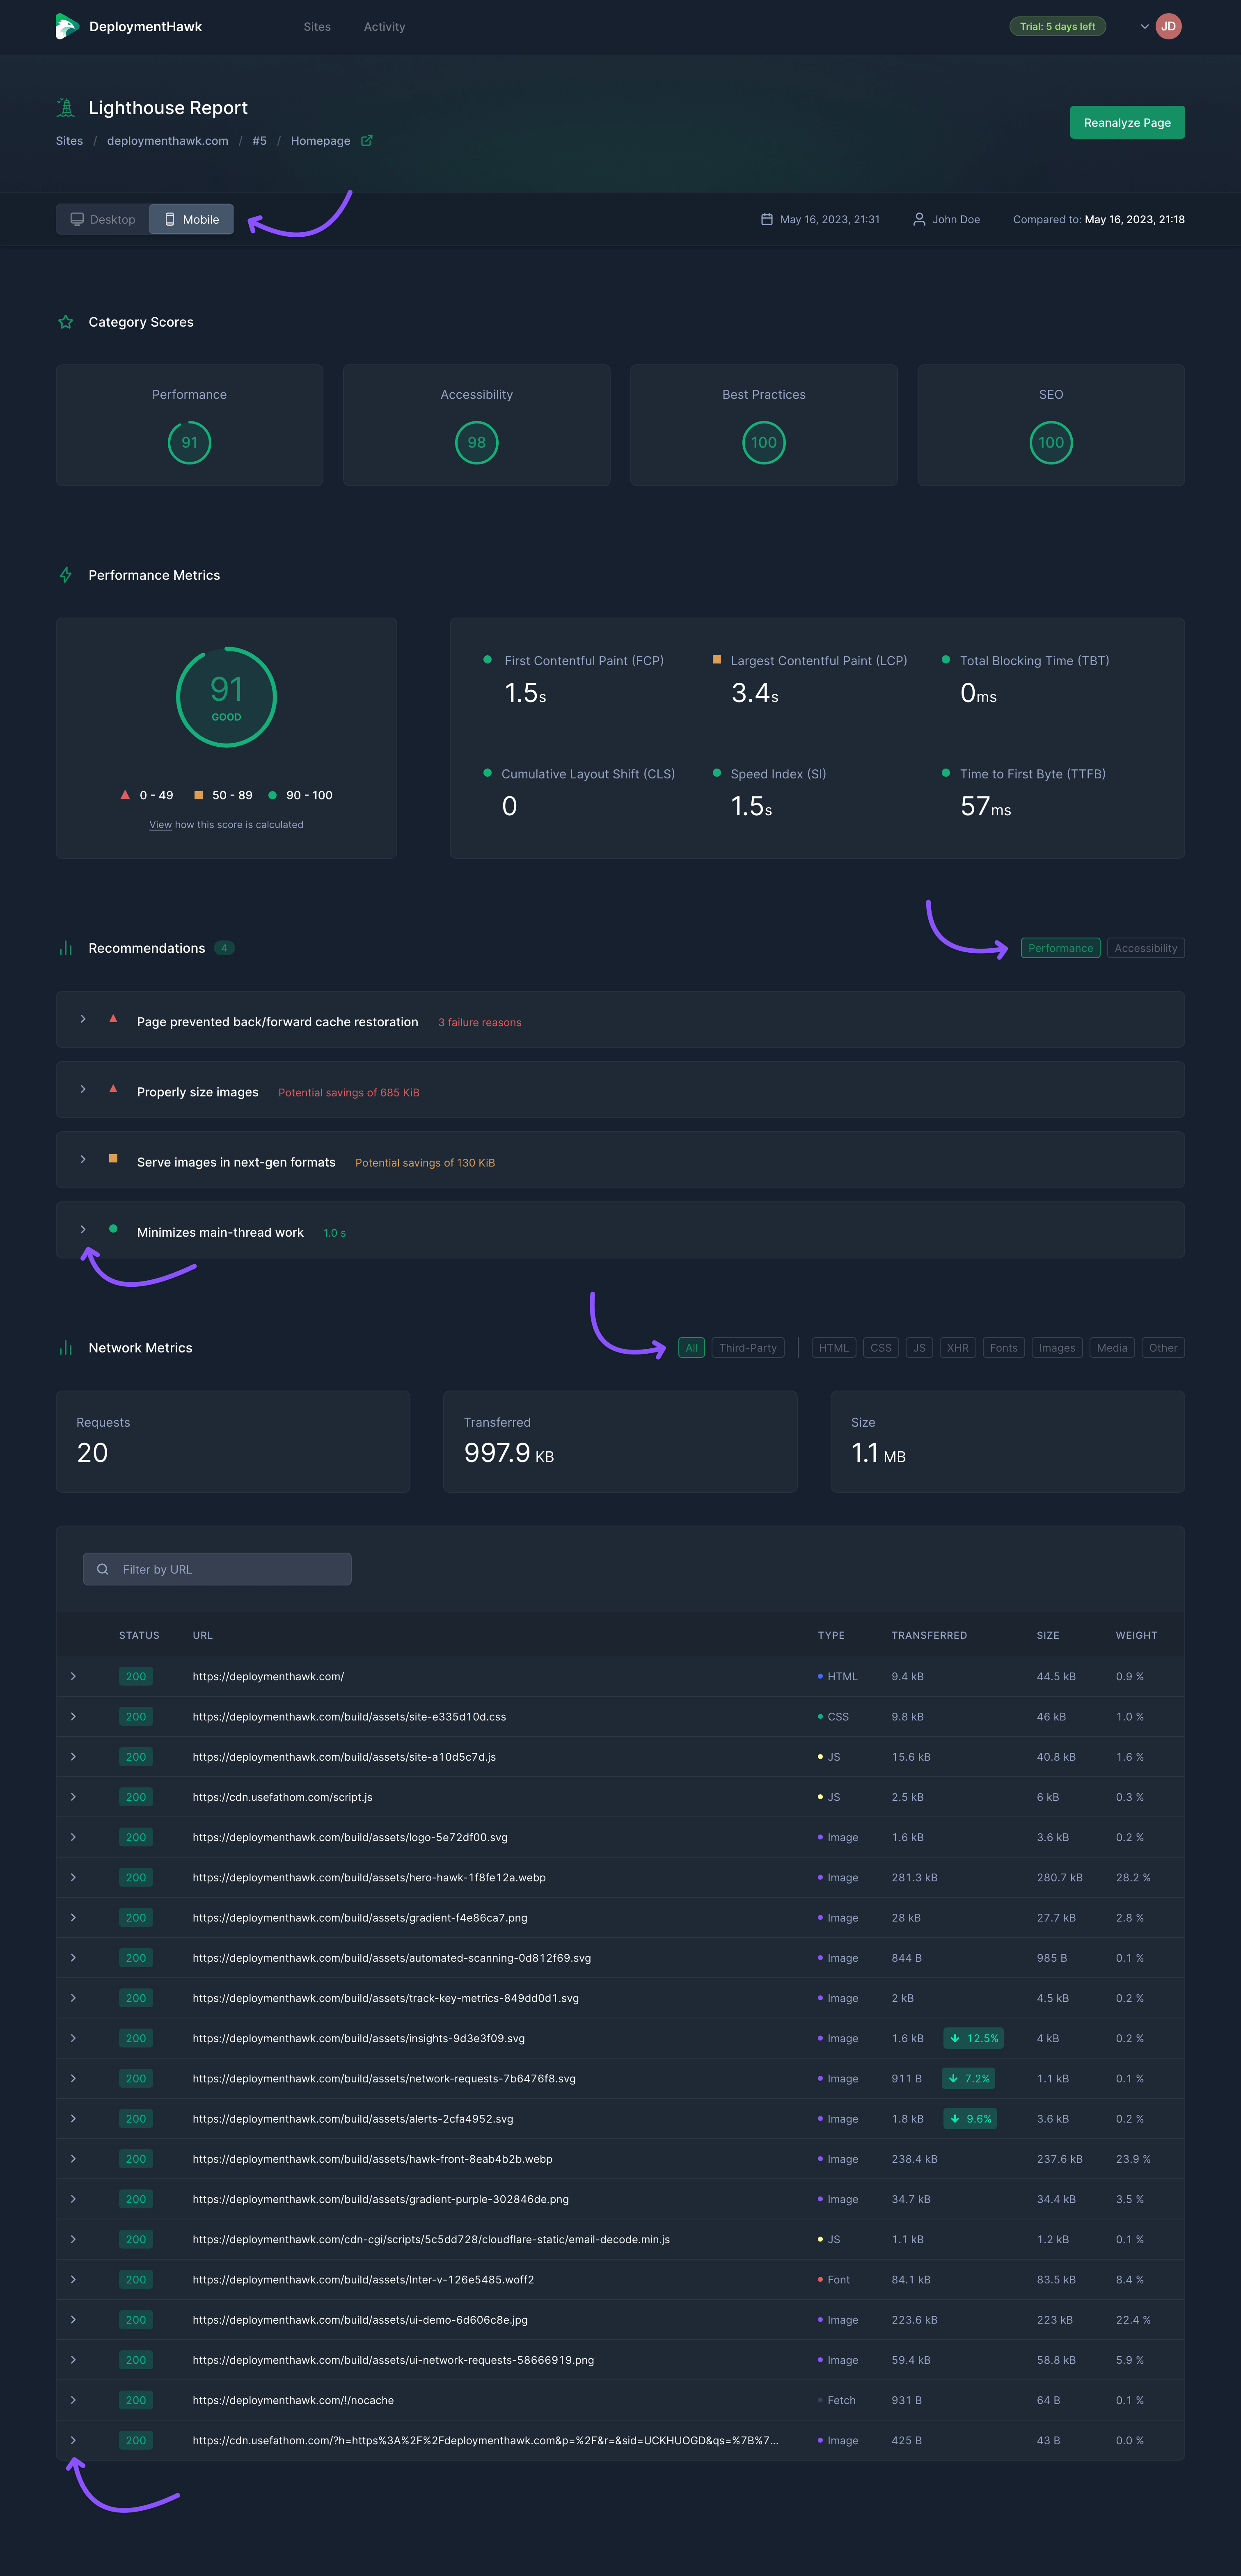
#Reports
Reports are your insights into the performance, SEO, and accessibility of each page. A report consists of 4 sections:
Category Scores. The Lighthouse scores for performance, SEO, best practices, and accessibility.
Performance Metrics. Key performance metrics contributing to the performance category score.
Recommendations. Actionable improvements you can make to the page to improve Lighthouse scores and overall user experience.
Network Metrics. Detailed information about all network requests performed during page load.
Remember, you can toggle between Desktop and Mobile reports to view device-specific scores, metrics, recommendations, and network requests. Recommendations and network requests can be filtered by type and expanded to view additional information.