Back to blog

Tom Rankin
Performance
How to Conduct a Google Lighthouse Audit
Every web development project requires an analytical look sometimes. Site speed and performance is one of the big priorities for almost every website, and Google offers some top-class tools for the job. A Google Lighthouse audit beats almost every other method available, due to its comprehensive metrics, and development flexibility.
For this post, we’ll look first at what a Google Lighthouse audit is in brief, then talk about why you’d want to implement one. From there, we’ll look at the methods you’ll use to run a Google Lighthouse audit, and end with a peek at a third-party app we know you’ll love!
#What a Google Lighthouse Audit Is
In a nutshell, Google Lighthouse takes the metrics of tools such as PageSpeed Insights and Pingdom Tools, and adds in the ability to assess the User Experience (UX) too.
 It does this in a number of ways. For starters, you have four primary audits that make up the whole: performance, accessibility, Search Engine Optimization (SEO,) and best practices. You also have a host of ‘opportunities’ – elements that don’t factor into your audit scores, but will help nonetheless.
 In addition, you can assess different ‘user flows’ based on the varying parts of the user’s cycle on your site. For instance, you can use the Navigation flow to assess a single page load. In contrast, the Timespan flow checks out your site over a time-specific range. You’ll use each of these during different parts of your site development and maintenance.
The full Google Lighthouse audit collates the individual audit scores, your site opportunities, and those results based on the user flow, and presents a report that lets your entire team assess the site.
As such, these audits can be a key way to boost performance on both the technical side, and the business one.
#Why Audits Are Necessary for Your Web App or Site
Google Lighthouse is a modern way to assess and analyze the speed and performance of your website. This is crucial, as most other tools only look at site speed. To rank well in search engines, you’ll need to understand and optimize more areas of your site.
For example, while speed is a ranking factor, so is site accessibility. Within those areas, you can dive into other metrics that might impact conversion rates, traffic figures, and much more. A Google Lighthouse audit will let you figure out why a site does or doesn’t perform well, and fix it.
The valuable ‘quality signals’ that are Web Vitals are something we only now have access to. They can help you take a ‘real-world’ look at how your site performs – on mobile, for example. This is (dare we say) vital, as you want to ultimately assess how a site feels rather than what the numbers say.
#How to Conduct a Google Lighthouse Audit (4 Methods)
Let’s get into the details. Next, we’ll show off four different methods you can use to run a Google Lighthouse audit. From there, we’ll talk about our last method – using a third-party app –and the benefits.
#1. Use the Web App to Run a Google Lighthouse Audit
First off, you can use the PageSpeed insights interface to launch a Google Lighthouse audit.
 This is because the tool now uses Lighthouse metrics whenever you run it. As such, it’s straightforward to engage:
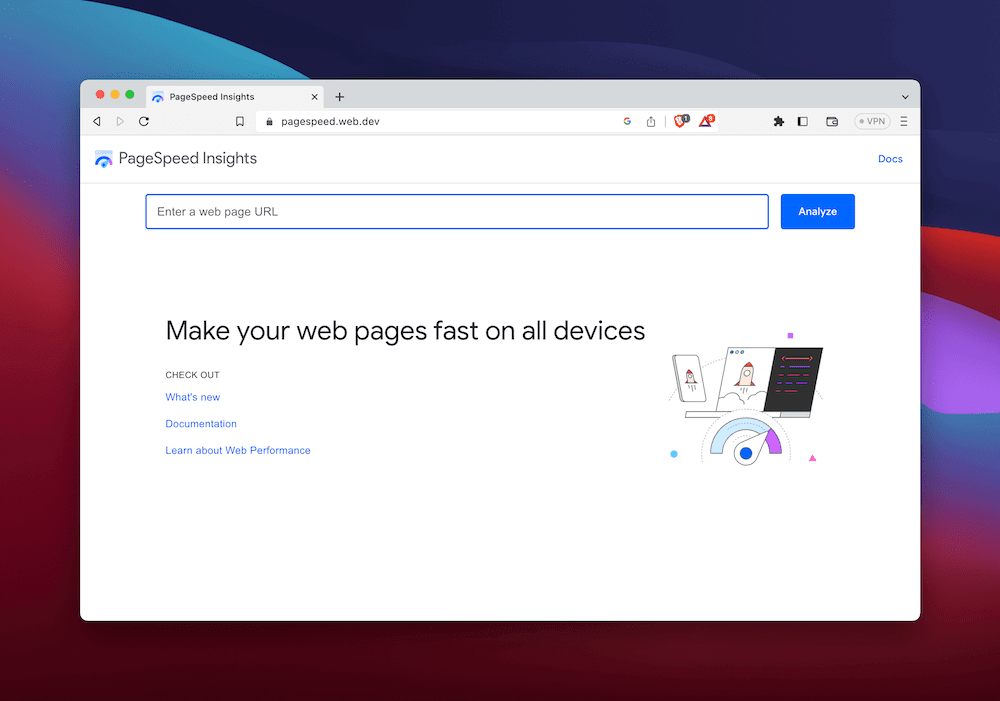
Navigate to the PageSpeed Insights site.
Enter your domain.
Click the Analyze button.
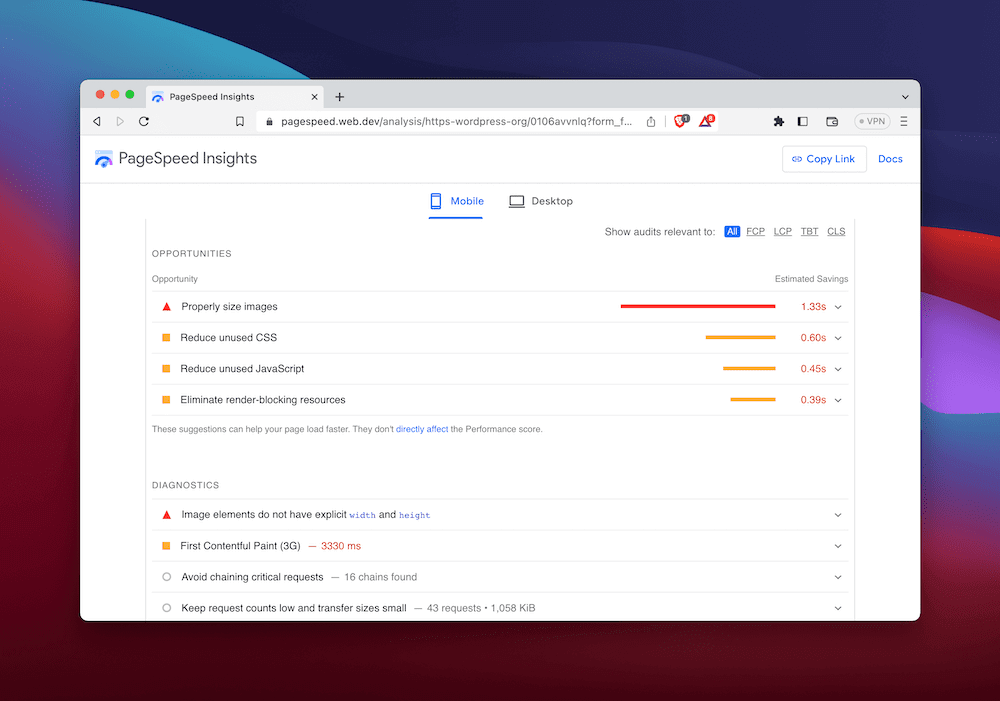
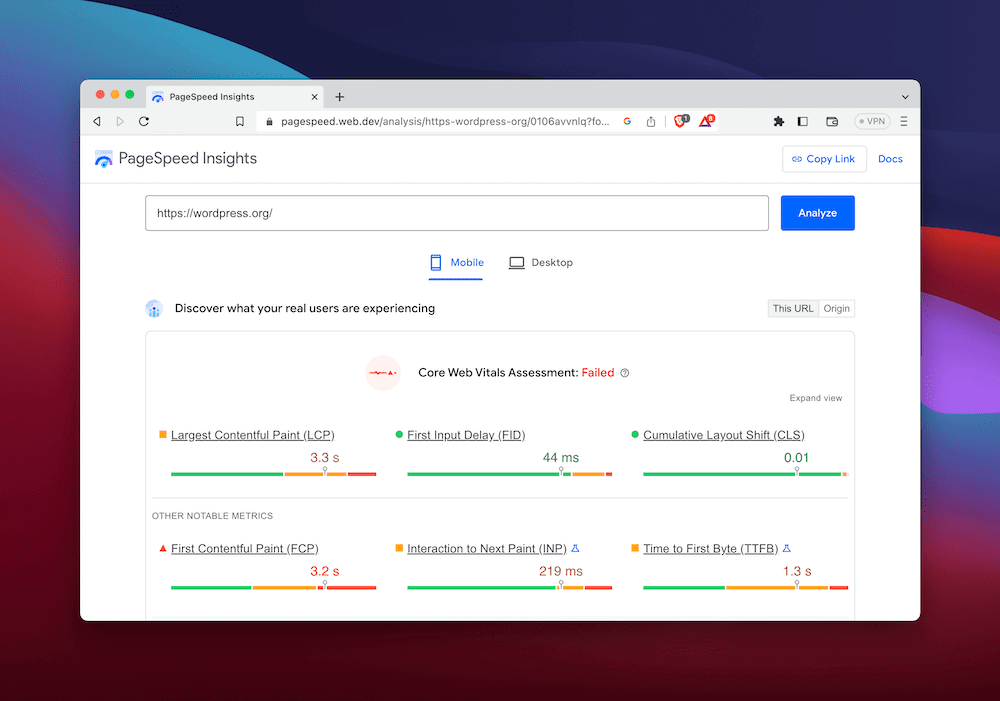
This will run the Google Lighthouse audit and present a report:
 This is super-fast to run, and you get all of the metrics you’d expect to see. It’s a method we’d imagine a lot of SEO experts and agencies will use, due to how efficient and intuitive it is. However, we can’t recommend this to developers, as you have no way to run an audit for a local environment.
#2. Run Google Lighthouse from Chrome DevTools
If you use the Chrome browser, you also have access to Google Lighthouse from the DevTools menu. In fact, any Chromium-based browser will have this. This means if you use Microsoft Edge, Brave, and others, you’ll be able to launch a Google Lighthouse audit from it.
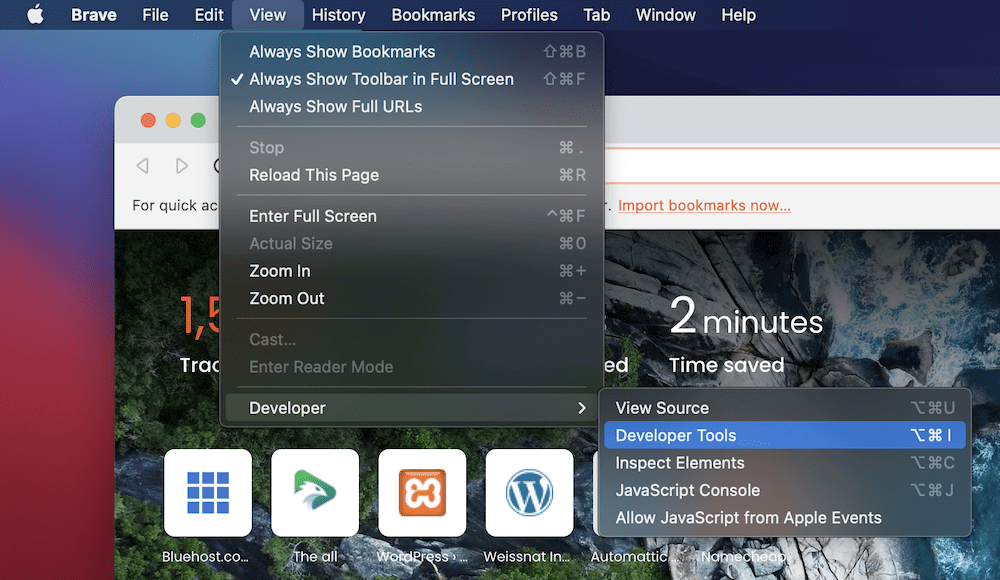
To start, open your Chromium browser of choice and head to whatever site you wish to audit. Next, look to the View > Developer > Developer Tools option in the browser toolbar:
 This will open up the DevTools control panel, within which you’ll want to navigate to the Lighthouse tab. You’ll be able to see options for the user flow, simulated device, and the audit categories you want to test for:
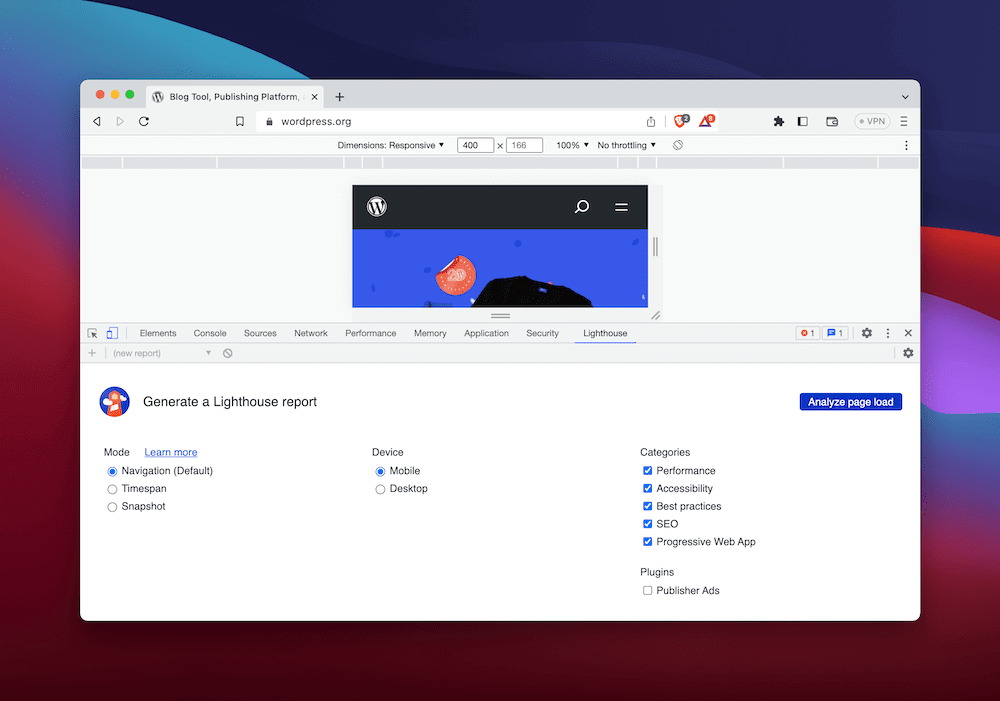 To perform the full audit, click the Analyze Page Load button. This will take about a minute to complete, at which point, you’ll view the report in the same DevTools window:
 This approach offers a little more flexibility than using PageSpeed Insights. For instance, you can audit any URL, which includes local development environments. It’ll have a lot of worth during certain stages of a project.
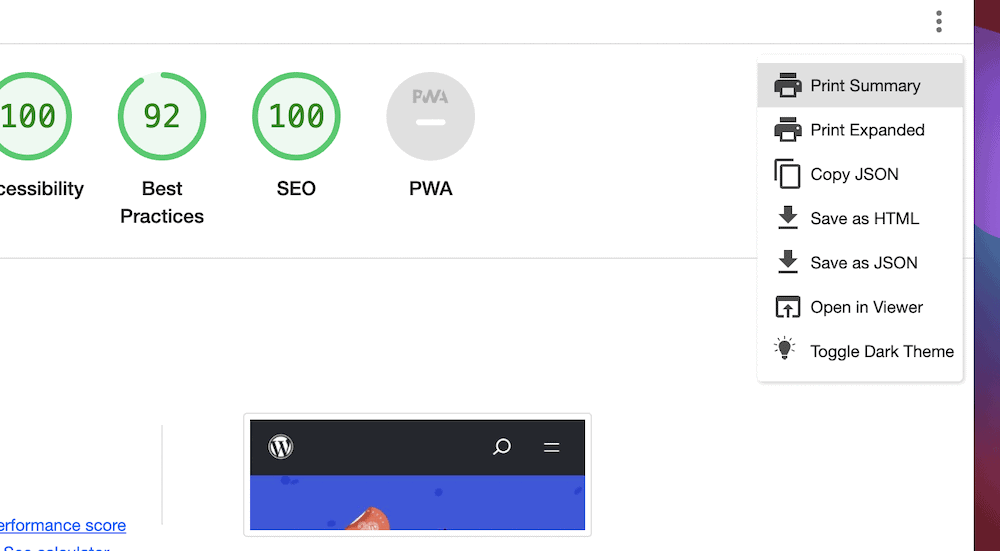
However, there are a couple of issues worth noting. First, we don’t like the constrictions when you view the report in certain window views. If you tend to use a horizontal window, the UX isn’t the best. Though, one thing to mention is that you can export the audit to a number of different formats, such as a JSON file:
# 3. Employ the Command Line Interface (CLI) to Run a Google Lighthouse Audit
If you use the command line on a regular basis – most developers likely will – you’re also able to run Google Lighthouse from there too. However, before you can use the audit tool, you have to install some prerequisites:
First, make sure you have an install of Google Chrome, as the process will need it during the audit.
Install the current Long-Term Support (LTS) version of Node.js, rather than the Current version.
From here, you can install Lighthouse using npm. Note that you’ll want to install it as a global module using the npm install -g lighthouse command:
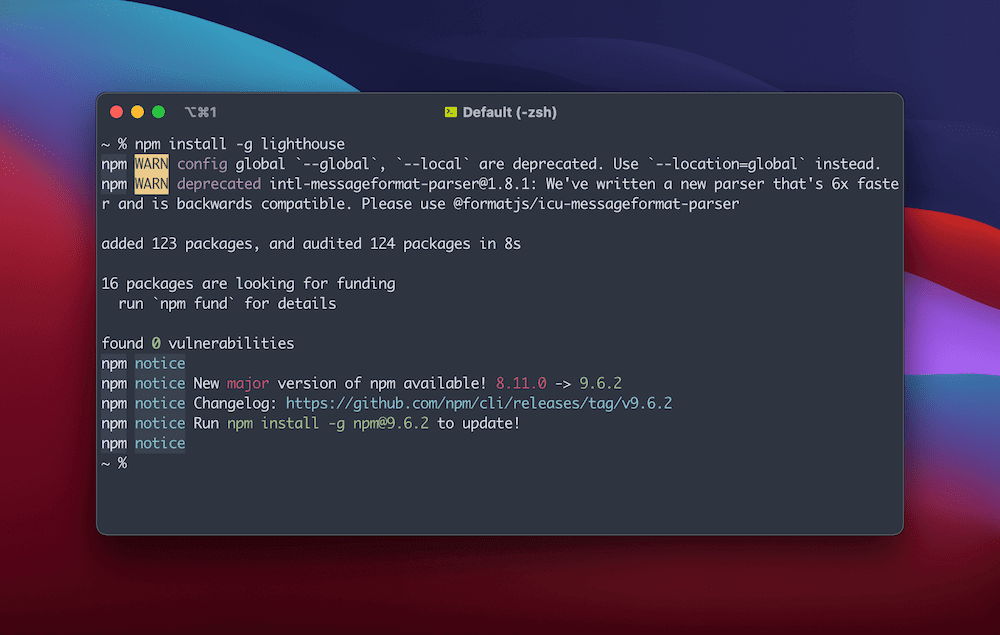 At this point, you can run an audit using the
 lighthouse <url> command (remember to replace the placeholder with the website in question.)
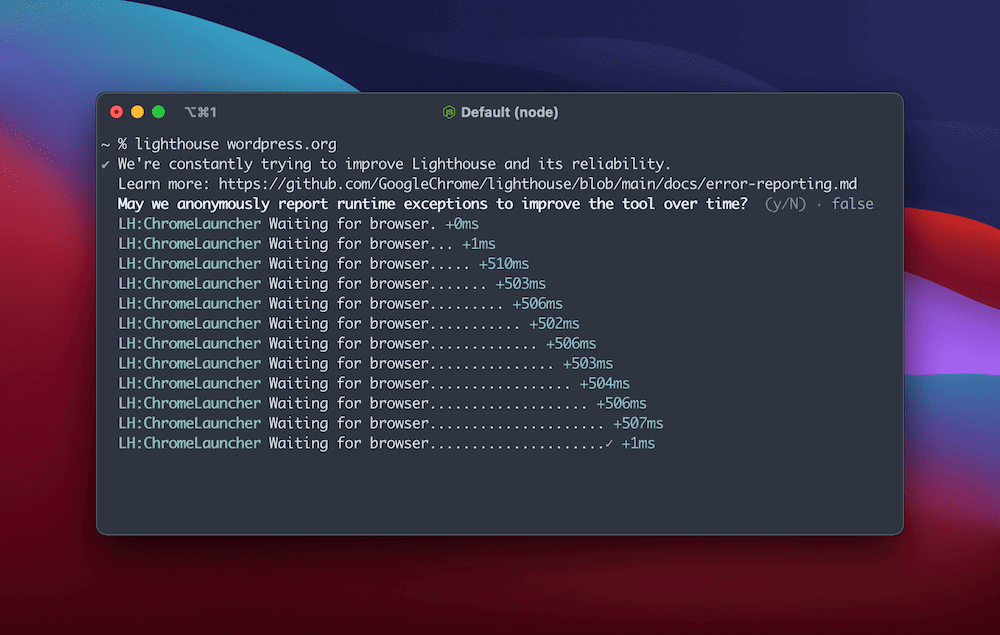 Note that you’ll want to specify the full URL of the website – including the protocol – otherwise you’ll encounter an error. Once you do run the audit, you’ll spot Google Chrome open on the website, while the command line will display real-time pings relating to various metrics:
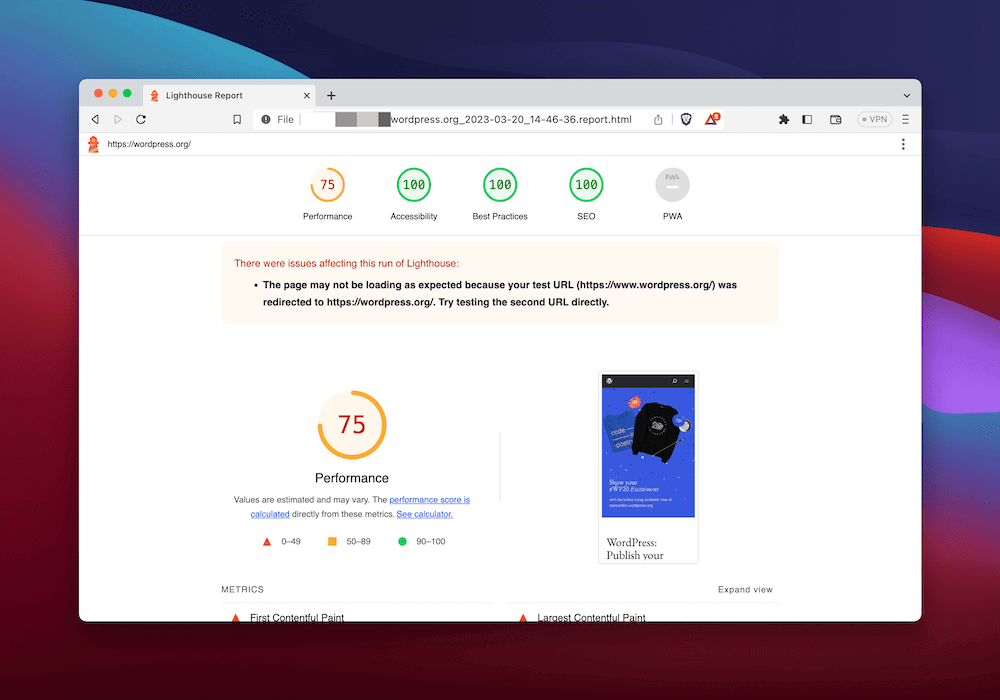
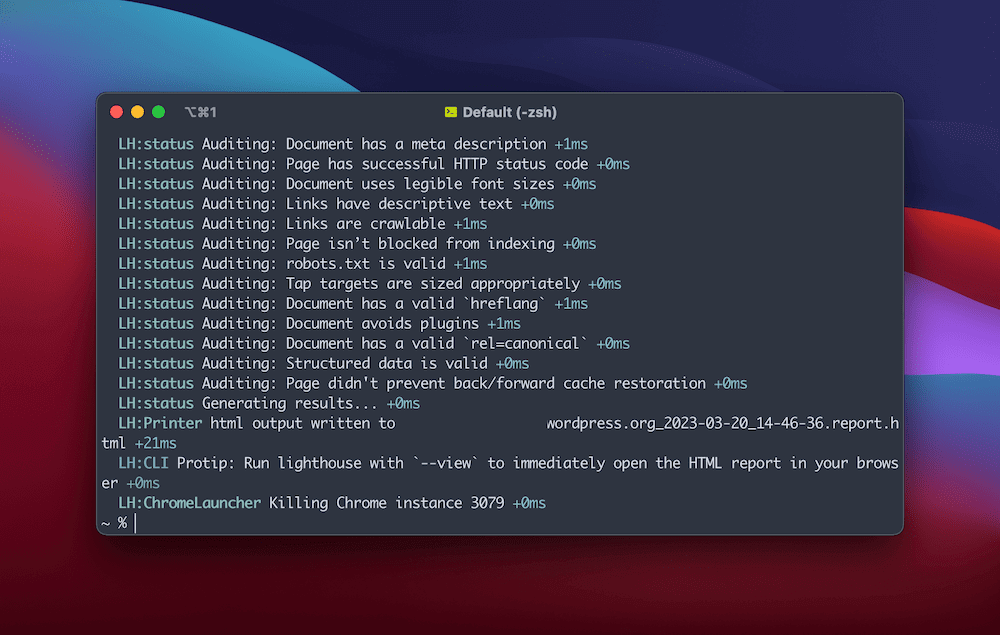 Lighthouse will save the report as a HTML file to a given location, and once you open it in the browser, you’ll see the familiar interface:
You can also open this report straight away using the --view option. There’s a lot of flexibility here, as you can see if you browse the lighthouse --help files.
However, you don’t have much automation: you’ll need to run this each time you want to conduct an audit, and remember all of the options to speed up the process. In these cases, you’ll want to run a programmatic version of Google Lighthouse using Node.
#Carry Out a Google Lighthouse Audit Using a Node Module
If you’re a front-end or full-stack developer, JavaScript can help you run a Google Lighthouse audit on a programmatic level. This gives you a number of benefits and flexible usage scenarios.
For instance, you might have access to your site through multiple URLs, or different design choices based on the visitor or referral. You also have the option to conduct different analysis processes based on your needs. Regardless, a programmatic way to run Lighthouse offers the ultimate in customization.
While we can’t give you a full tutorial on using a Node module here, we can offer some starter points of advice:
You’ll (of course) need to install Lighthouse as a dependency.
There are three points where you can specify custom options for your run: the test URL, your Chrome options, and Lighthouse’s configuration object.
You pass Chrome options to
chromeLauncher, and Lighthouse config options to its own Dictionary.
You’re also able to customize the reporting aspect too, either using JSON, HTML, or a Lighthouse Result Object (LHR). What you gain in flexibility you also gain in complexity. This can be a problem if you want to customize your audits without coding your way out of a paper bag. This is where a third-party app could come in handy.
#4. Use a Third-Party App to Run a Google Lighthouse Audit
Because Google Lighthouse is an open-source tool, you can (in theory) have a number of third-party solutions that hook into it directly, rather than through an Application Programming Interface (API.)
This opens up the scope of what you can achieve with your audits, and means Lighthouse can step into your workflow rather than impose itself. It’s yet another positive for the performance tool.
In fact, we have a third-party app to mention – DeploymentHawk. Let’s talk next about why you’d want to use this app to run a Google Lighthouse audit.
#Using DeploymentHawk to Run Google Lighthouse
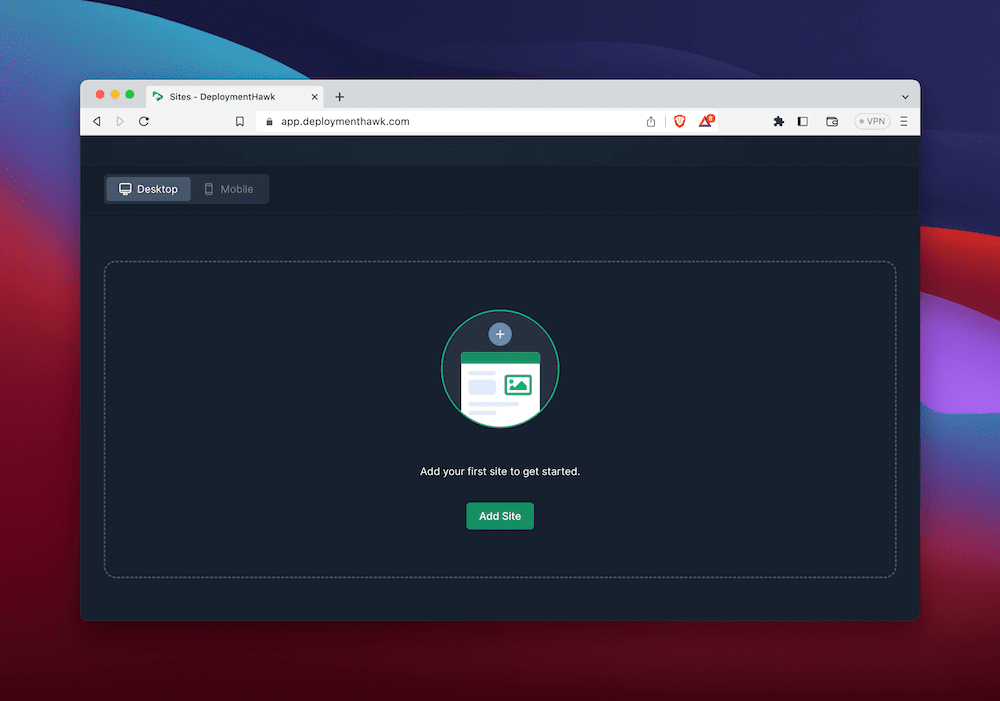
To use DeploymentHawk, navigate to the dashboard. The screen will look bare without any sites, so click the Add Site button to begin that process:
 This will ask you to add a full URL for your chosen site, at which point it will begin an initial analysis:
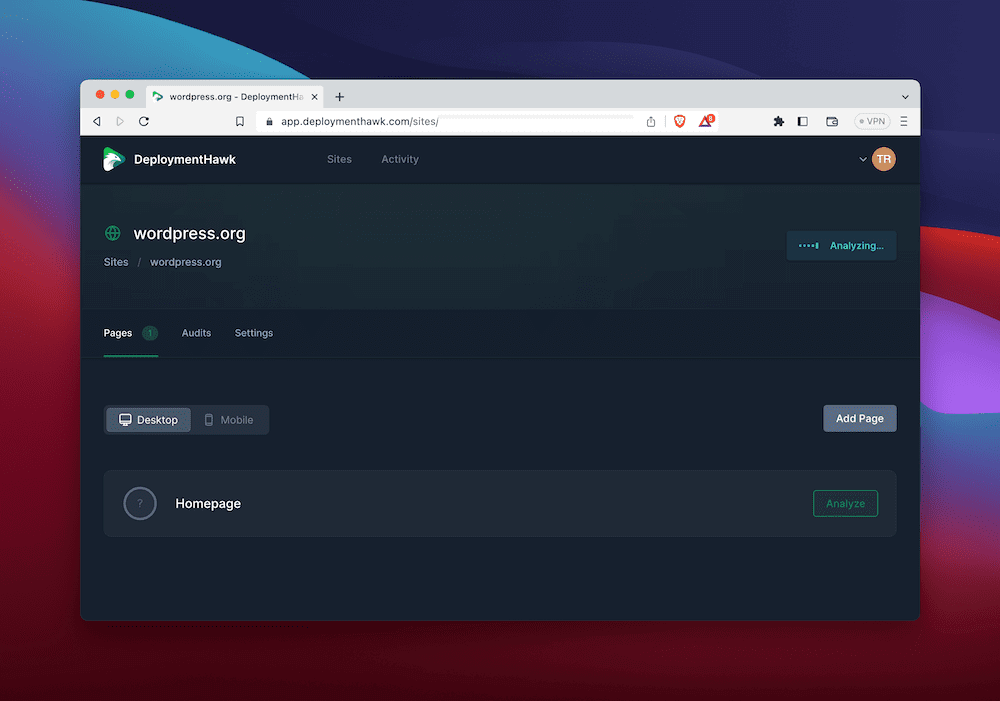 To view a report, you can click through to the site within DeploymentHawk and take a look at it:
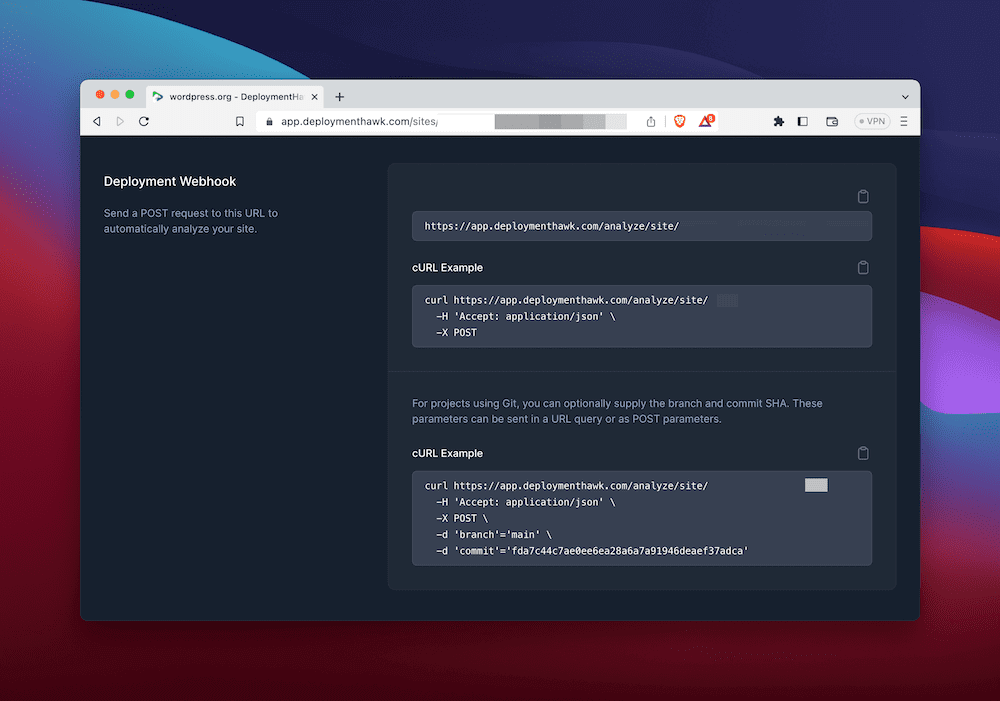
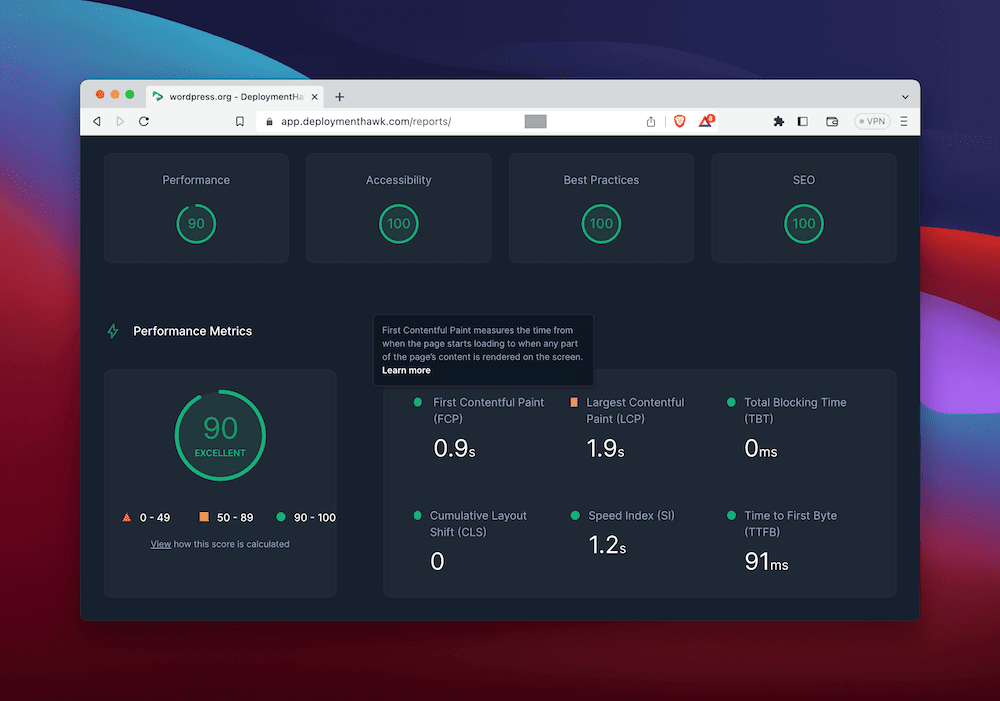 One of the great benefits of DeploymentHawk is how you can run an analysis any time you wish, that doesn’t rely on scheduled scans. What’s more, you don’t need to worry about complicated programmatic methods using Node modules. This is because you can send a
 POST request using a webhook to achieve almost the same level of functionality:
# Conclusion
It’s fantastic that you now have an in-depth way to assess the performance of your sites on more than speed. It means you can make an accessible site with an ideal UX and have the numbers to back it up. Google Lighthouse makes this possible, and you can launch it in a number of ways.
For instance, lots of agency users might run a Google Lighthouse audit from the ‘official’ web app. In contrast, developers will want to refer to results from the command line, or a Node module.
A near-perfect middle ground is DeploymentHawk. This lets you grab audit results and view them in a dedicated interface in the browser. You’ll be able to do this without the need for scheduling, and can find insights thanks to real-time notifications too.