Back to blog

Tom Rankin
Performance
An Introduction to Google Lighthouse
All manner of site owners worry about site speed. This makes sense, as it also matters for your Search Engine Optimization (SEO.) However, your site’s overall experience is also important. As such, you’ll want to take a look at this introduction to Google Lighthouse. It’s a tool that can help you improve the quality of your websites.
For this post, we’ll give you a full introduction to Google Lighthouse, and talk about how to use it. First though, let’s discuss what Google Lighthouse is, and why we need it.
#What Google Lighthouse Is
 Google Lighthouse looks to assess the performance and experience of your site across the internet. Site speed isn’t enough to rank well on the modern web, as you’ll need to nail a number of other factors, such as accessibility.
Much like other site assessment tools (such as PageSpeed Insights,) Google Lighthouse can run almost any live URL whether that’s a public page or one that requires authentication.
 However, this tool offers more scope to help you improve the overall site experience. For instance, you have different audits for general performance, accessibility, SEO, and more. You’ll get these in a report format, along with hints and tips to improve your score.
 On the whole, Google Lighthouse gives a developer or advanced site owner more information and insights on performance than other tools will. Even so, the tool is accessible to all users thanks to its intuitive approach and ‘real-world’ audit explanations.
#Why Google Lighthouse Exists
Google is notorious for hiding away its ranking metrics and factors. It leaves many developers and site owners with the need to make an educated guess on what the search giant wants. Google Lighthouse extends a hand thanks to its deeper reporting.
What’s more, the ‘science’ behind achieving a good ranking is now more in-depth than simply ‘be fast.’ For example, Web Vitals provide ‘quality signals’ that will help you implement a good User Experience (UX) for your sites. So far, there has been no direct way to monitor these or know exactly how to act.
In fact, Google Lighthouse and PageSpeed Insights use the same metrics now, but both help you achieve different goals.
#How Google Lighthouse Helps You to Judge Site Quality
Overall, Google Lighthouse provides more of a real-world look at your site’s speed and experience. One of the ways it does this is through how it measures sites under the hood.
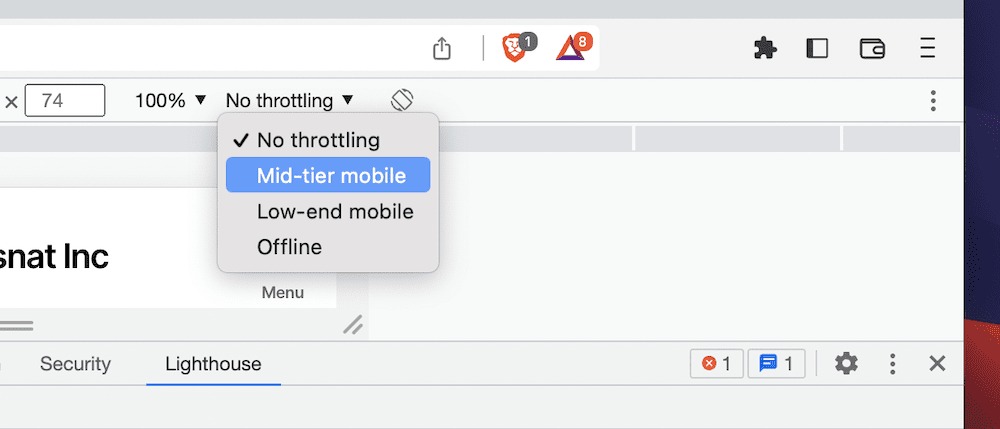
For example, to test mobile performance, Lighthouse will use a 3G simulation that suffers from issues such as dropped packets, in addition to the typical throttling options. This gives your site a stress test under typical user conditions, rather than perfect ‘lab conditions.’
 Of course, this is essential if you want to improve your site’s experience for users. One of the reasons Google Lighthouse is a help is down to how it lets you assess how a site feels, rather than simply how fast it runs.
Depending on the metrics you focus on in a typical situation, you can score high on PageSpeed Insights or even apps such as Pingdom Tools or Gtmetrix. However, this might not translate to the user’s experience. This is where Web Vitals – and by extension Google Lighthouse – shines.
#How You Can Use Google Lighthouse in Day-to-Day Development
Other tools – Gtmetrix, Pingdom, even PageSpeed Insights – are all passive. By this, we mean you’ll head to the specific tool, run it, and take in the results. However, we think Google Lighthouse is something you’ll use throughout the development cycle of your project.
This is because of a few reasons:
First, Google Lighthouse offers flexibility in the way you run the tool. We’ll talk about this in a later section. You’re able to also run Lighthouse using JavaScript. This gives you greater scope to customize your tests, collect and analyze the results, configure the options for your specific site, and much more.
Unlike the ‘cold flow’ approach of other performance measurement tools, Google Lighthouse can analyze and report on the entire page cycle. It uses three different user flows, and we’ll also discuss these later.
There are multiple ways to share reports using JSON files or even GitHub Gists. You’re able to view both of these in a dedicated Lighthouse Viewer.
Lighthouse uses Stack Packs to assess the hardware and software stacks of a particular website. From there, you can receive community recommendations on specific improvements for the user’s Content Management System (CMS.)
There are even dedicated Lighthouse plugins with development documentation too. Even better, you can integrate Google Lighthouse into your own apps, so all users can benefit from the metrics you receive.
#How to Launch Google Lighthouse for a Web App
We mention how Google Lighthouse is flexible with regards to how you can launch it. There are a lot of methods, but you won’t want to use all of them. There are four key ways to launch Google Lighthouse:
There’s a web User Interface (UI) that you’ll already know. PageSpeed Insights uses Lighthouse metrics, so this is a valid way to run a site audit without the need to install anything.
Chrome DevTools is the ‘official’ way to run Lighthouse within the browser.
You can use the command line to run shell scripts and audit a site.
You’re also able to use a Node module to integrate Google Lighthouse into your Continuous Integration (CI) platform.
There’s also a Chrome extension to help you run Google Lighthouse audits. However, it’s not a recommended method. This is because it lacks specific functionality such as testing for local and authenticated pages.
#Running a Google Lighthouse Audit
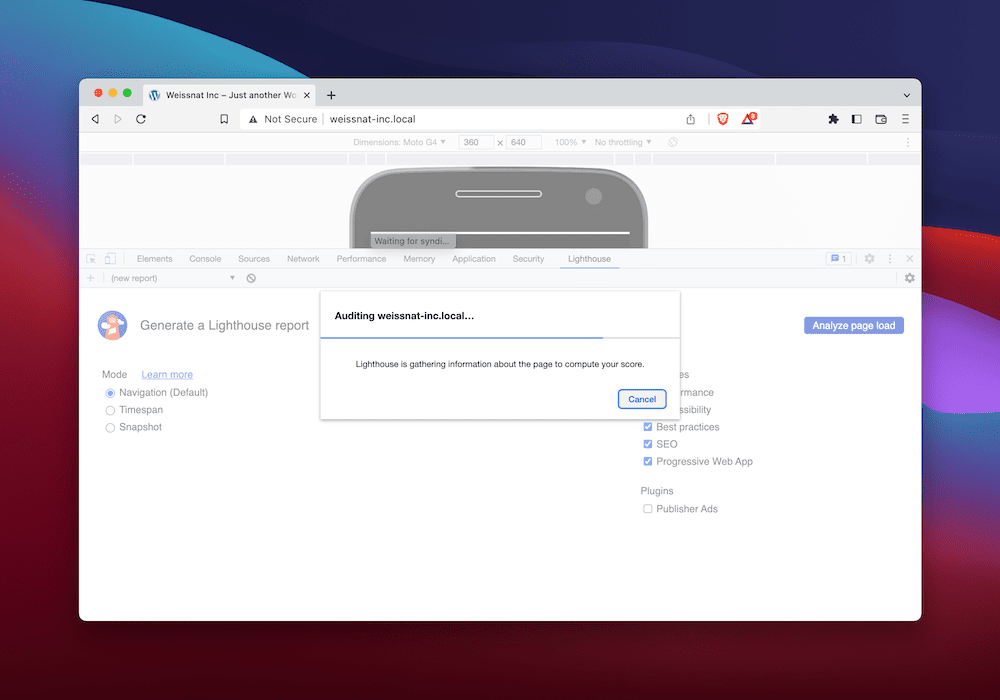
Of course, the different ways to access Google Lighthouse also have varying ways to launch it and run an audit. For instance, the web interface versions of the tool have simple one-click button presses to start. In Chrome DevTools, you’ll find the report under the Lighthouse tab:
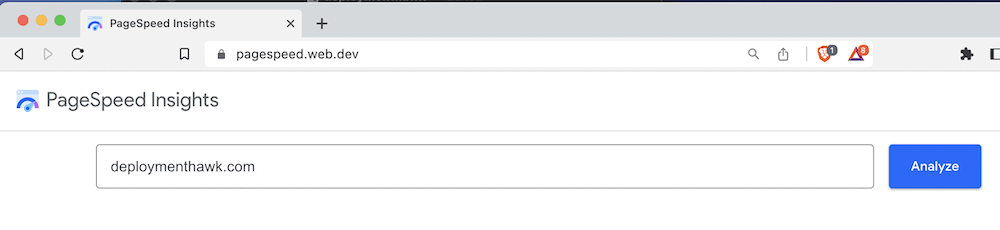
 If you choose to run Lighthouse in PageSpeed Insights, the process involves entering the URL, then pressing the Analyze button:
 However, if you want to launch Google Lighthouse using the command line, you’ll first need to follow a few more steps:
Download Google Chrome for Desktop if you need to.
Install the latest Long-Term Support version of Node if required.
Use the npm package manager to install Lighthouse as a global module.
From here, you can run an audit using the lighthouse <url> command, where the placeholder will be the full URL of your site.
You’ll find that the programmatic method using a Node module is super powerful and flexible. However, the trade off is the set up. While we can’t cover the full details in this article, we do have a dedicated post on choosing the right way to launch Google Lighthouse.
#User Flows
You can assess the entire page lifecycle with Google Lighthouse. There are three specific user flows to note:
Navigation. This is the default user flow, and analyzes a single page load.
Timespan. If you want to assess user interaction over a certain period of time, this is the user flow for you.
Snapshot. You’ll employ this user flow to analyze a page in a specific state at a particular point in time.
You’ll use these user flows at different times. For instance, to obtain a Performance score you’ll use Navigation. However, to assess the page in its current state, the Snapshot user flow will be more suitable.
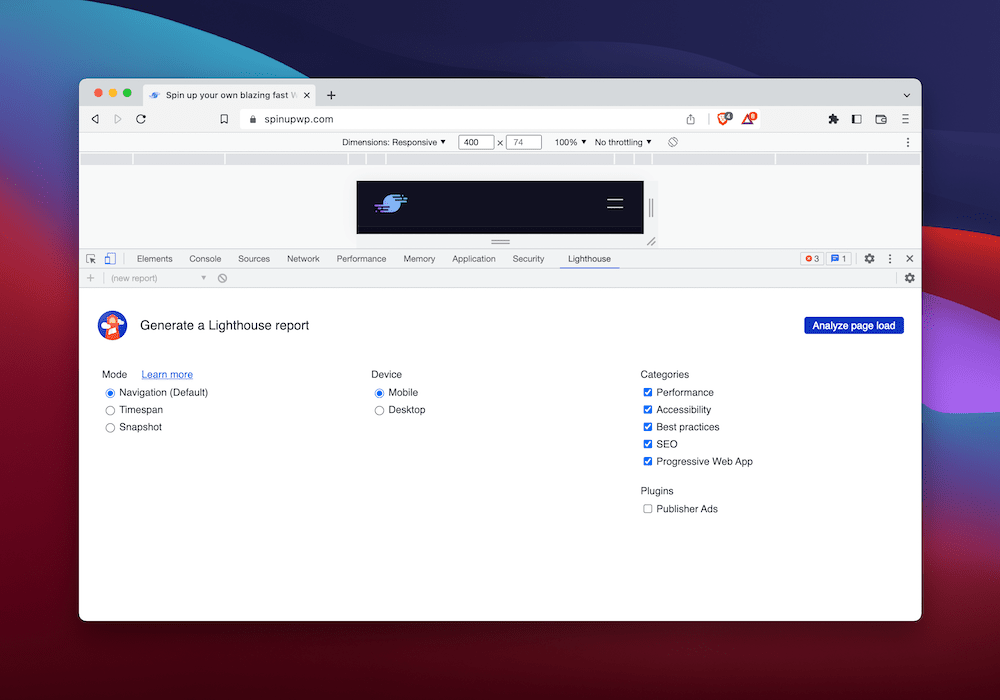
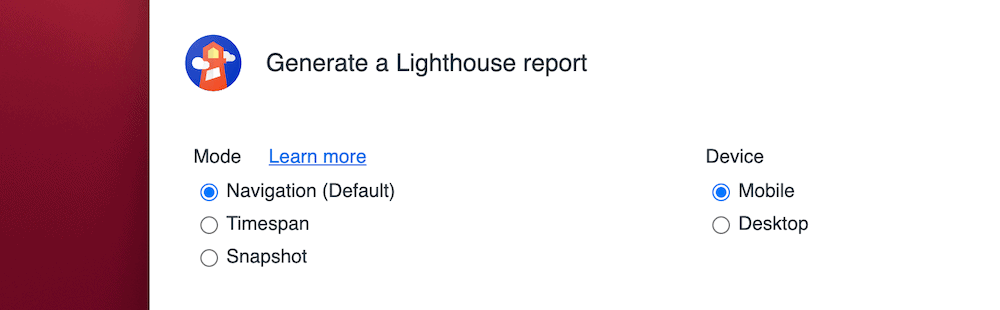
Of course, each launch method will have its own way of choosing a user flow. In Chrome DevTools, you’ll select from three radio buttons:
 You can even combine these user flows to capture and analyze the entire UX for a page or site. To do this, you’ll need to use the Lighthouse Node API and the Puppeteer Node.js library. This lets you analyze a multi-step user flow using custom settings. You can also have greater scope to debug your work based on explicit output.
For instance, you could use the Navigation user flow to assess both the user hitting the page and also clicking a link. In between, the Timespan user flow can help you analyze any dynamic interaction on the page, such as using a search form. You can slot in the Snapshot user flow anywhere you need to assess the state of a page in its current form.
#Reading the Lighthouse Results
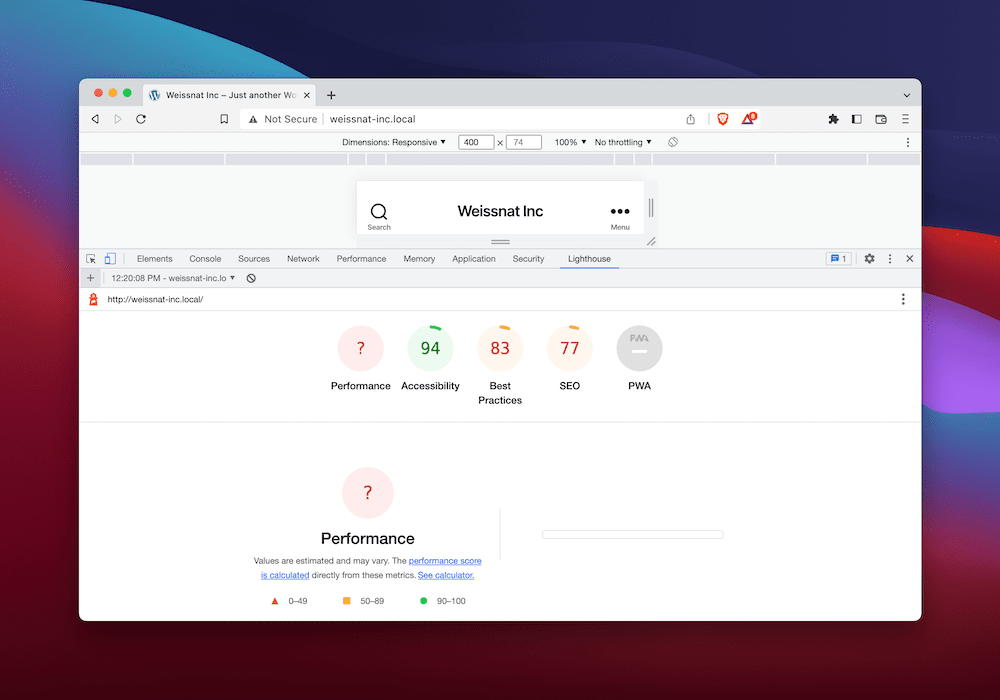
Once you run an audit, you’ll receive a report of the results:
 There are up to five different categories to take in, and other than the PWA audit, each has a score out of 100. It’s a weighted value based on the individual metric’s results. This is a good way to see your efforts at a glance, although you’ll want to drill down further to the metrics for each audit.
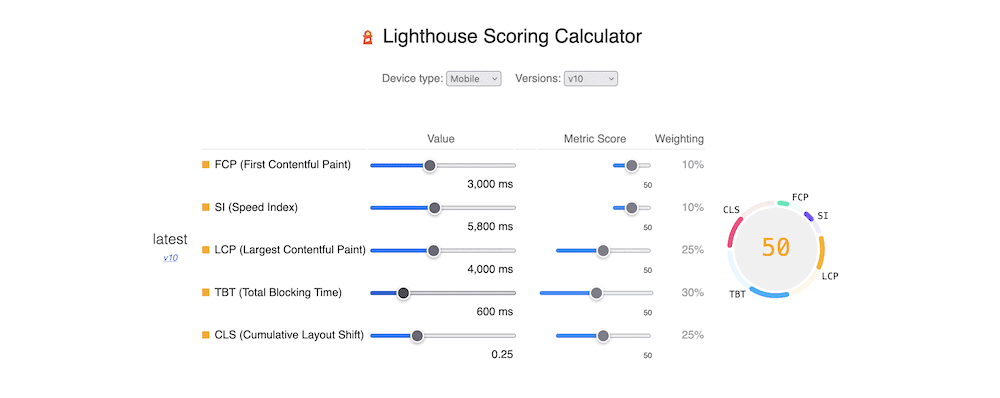
For example, there are five metrics for the Performance category:
First Contentful Paint (FCP)
Speed Index
Total Blocking Time (TBT)
Largest Contentful Paint (LCP)
Cumulative Layout Shift (CLS)
Each of these has a specific ‘weight.’ We’ll talk a little more about this at the end of the article, but this will impact how you look to improve your audit scores.
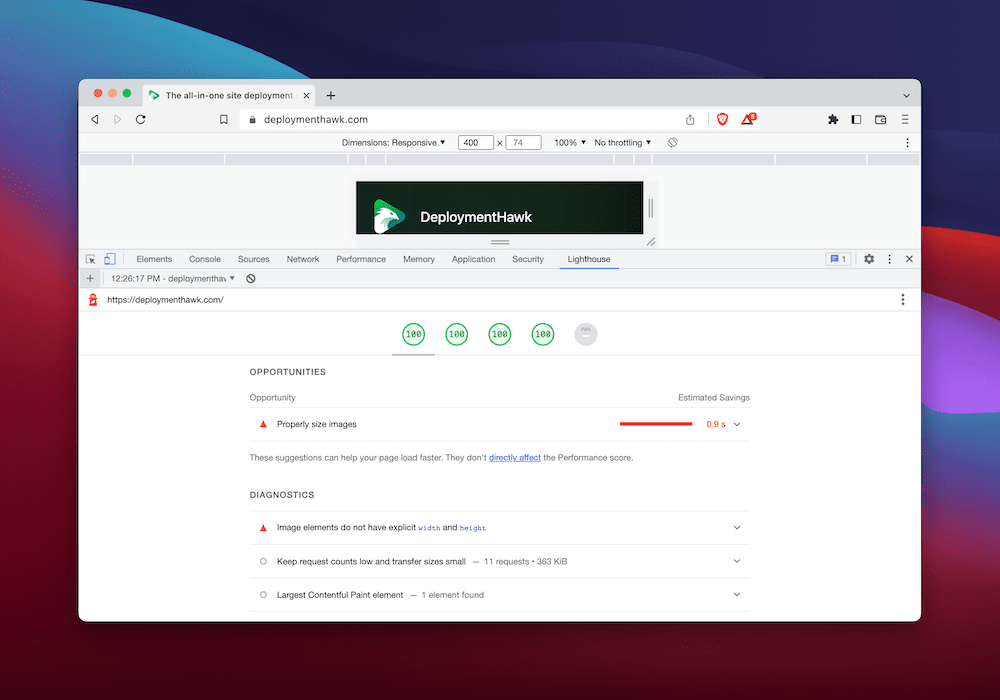 You’ll also find a bunch of ‘Opportunities’ and Diagnostics to view. Each of these will give you some actionable advice on how to boost the performance of your site. However, they don’t directly impact your overall Lighthouse score, but they can help your site load faster.
#Using Third-Party Apps to Analyze Your Google Lighthouse Score
Because you’re able to integrate Google Lighthouse into your own workflow, this means there is the opportunity to use third-party apps that pull in its data. DeploymentHawk is a case in point:
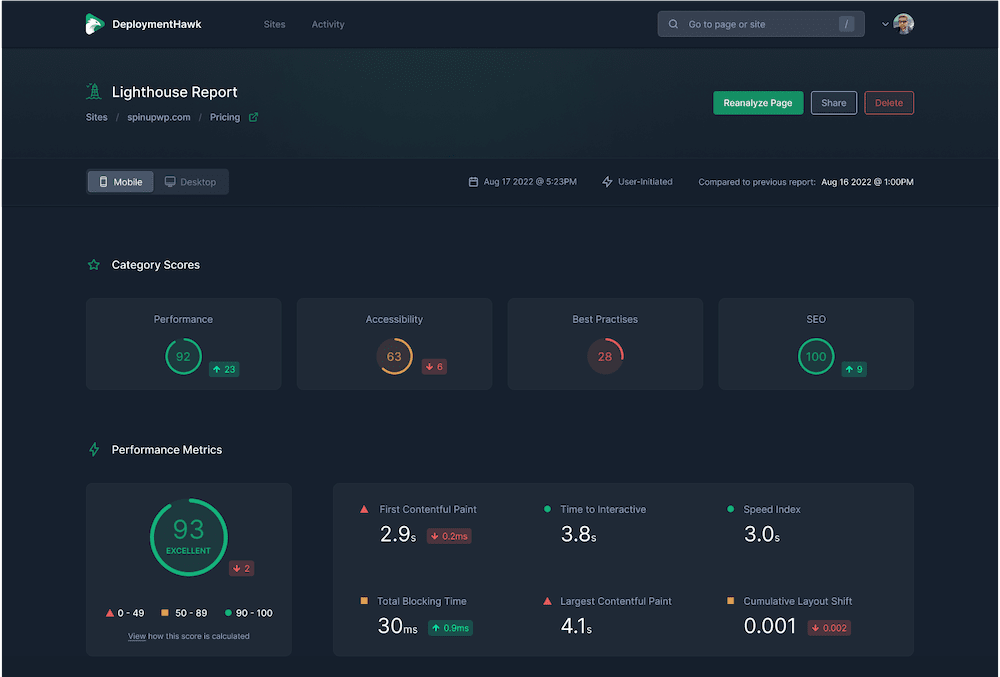 This builds on top of Lighthouse audits to help you implement an automated way to monitor multiple pages at once. Here’s what else it can give you:
You’ll also have deep insights into how the changes you make on-site and under the hood impact your user’s experience across desktop and mobile devices.
Once you deploy a site, you can monitor it without waiting time or delays.
#Improving Your Lighthouse Score
Something that Google isn’t known for is sharing details on how it scores websites for search rankings. However, for Lighthouse, you have lots of information to help you deduce the audit results and scores.
Weighting is the name of the game here, and this lets you focus on areas that have a greater priority for the score. In contrast, you might choose to focus on smaller portions to take a score from great to excellent.
For example, if you want to improve your Performance audit score, you should focus on TBT, LCP, and CLS as these account for 80 percent of the total rating.
There’s even a dedicated calculator to help you decide what’s important or not when it comes to your target score:
 The scoring distribution that refers to these calculations comes from the HTTP Archive – a record of the performance and incidentals for all of the top websites. As such, you’ll know that in theory, your site will perform as well as the best given a higher score.
#Conclusion
Almost everyone who builds and runs websites knows that speed is important. However, while you might also know that the experience of a site is crucial for success, not many tools will help you measure it. Google Lighthouse looks to redress the balance using metrics for a number of key areas.
Even better, a third-party tool such as DeploymentHawk will help you audit and analyze your reports once you deploy it. This means you can forget about waiting for scheduled scans, and work on problems as and when you get real-time notifications.